
Sponsored

Energy Monitor Screen - Session Details... Understanding????

BTOR

Well-Known Member
First Name
Brad
Joined
Dec 2, 2024
Threads
15
Messages
241
Reaction score
157
Location
PNW
Vehicles
2023 Bolt, 2025 R1S
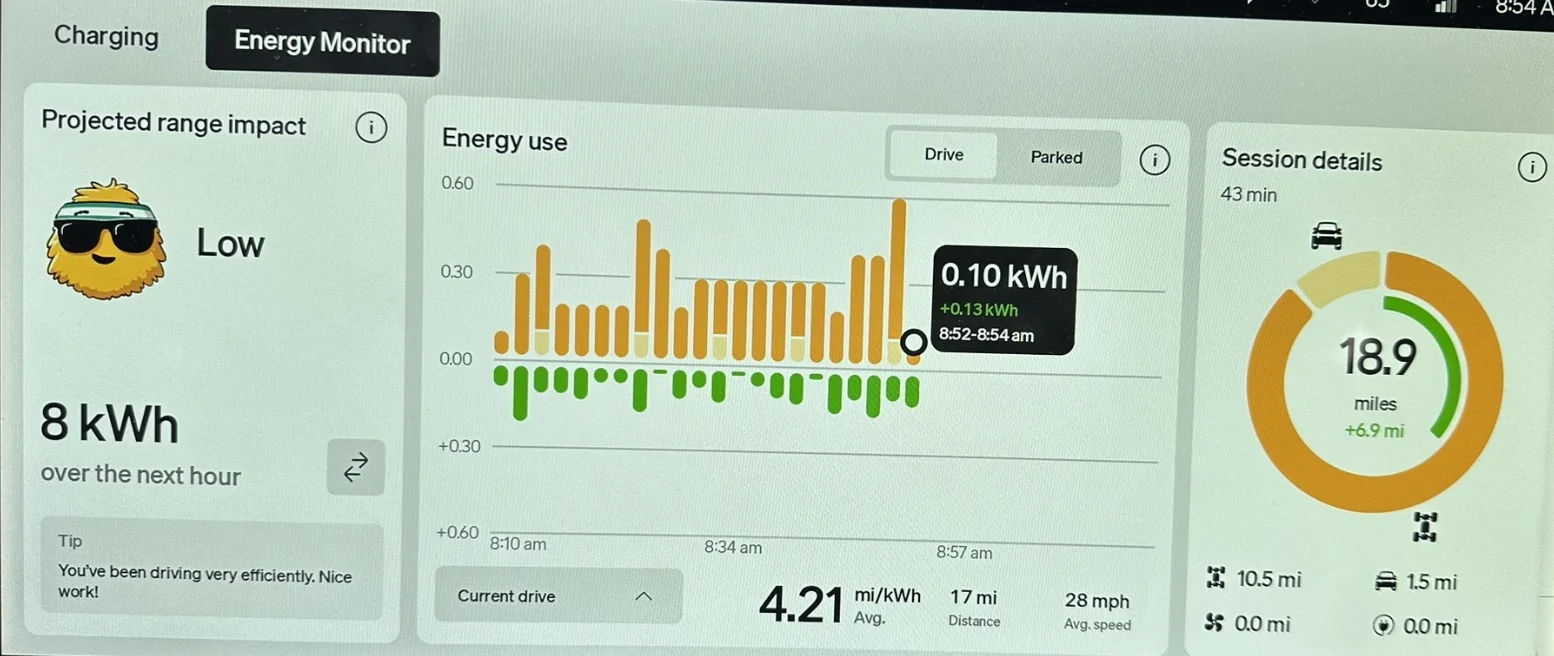
In the attached picture, the "Session Detail" shows a value of 18.9 miles. This is the sum of 10.5 miles (to propel the vehicle?), 1.5 miles (vehicle operation?) and 6.9 (drive regeneration total?). And, according to the Energy Use during drive, the actual distance driven was 17 miles with an efficiency of 4.21 mile/kWh.

So, based on the efficiency and actual miles driven, I used ~ 4.0 kWh during this Session (17/4.21). Is it correct of me to assume then that of those 4.0 kWh used during the session, 87.5% or 3.5 kWh (10.5/12 x 100 = 87.5) were used to to cover the 10.5 miles and the remaining 12.5% were used to cover the 1.5 miles? Since 10.5+1.5 = 12 miles and I actually drove 17 miles, 5 miles were "free" as a result of regen? I also assume the "Session Details" is a summary or sum of the bar graph to the left which is reported in kWh usage as a function of time, since the colors for the 3 specific categories (propel, vehicle, & regen) are identical.

If my understanding is incorrect, please straighten me out. If my understanding is basically correct, what the heck is the significance of the "Session Details" value adding the usage miles (energy used?) and regeneration miles (energy gained) and then reporting it as total in miles? Why would someone at Rivian feel this value has so much significance to the driver that they felt compelled to display it? I feel I am clearly missing something? I would think the "Session Details" would be much more meaningful to display kWh used and generated and the reported number being the "net" amount, not the total of used plus regen 🤦‍🤷‍♂️.

To me, the most important values (and only meaningful values) on this Energy Monitor screen are the efficiency and actual miles driven. I often compare the actual miles I drove to the predicted range based on SOC at the start and end of my drive. (which is visible on the center display). If the difference between the predicted range at the start and finish of my drive is less than the actual miles I drove, then I at least feel I am ahead of the game 😎.


Rivian R1T R1S Energy Monitor Screen - Session Details... Understanding???? Screenshot 2026-06-20 at 09.38.37
Sponsored

 
OP
OP
BTOR

BTOR

Well-Known Member
First Name
Brad
Joined
Dec 2, 2024
Threads
15
Messages
241
Reaction score
157
Location
PNW
Vehicles
2023 Bolt, 2025 R1S
Tap on the center number and it will change to kWh instead of miles. Using miles is stupid
Ah, great! TY for letting me know. I knew I was missing something.... Yes, I agree, using miles is totally stupid.
 
OP
OP
BTOR

BTOR

Well-Known Member
First Name
Brad
Joined
Dec 2, 2024
Threads
15
Messages
241
Reaction score
157
Location
PNW
Vehicles
2023 Bolt, 2025 R1S
Tap on the center number and it will change to kWh instead of miles. Using miles is stupid
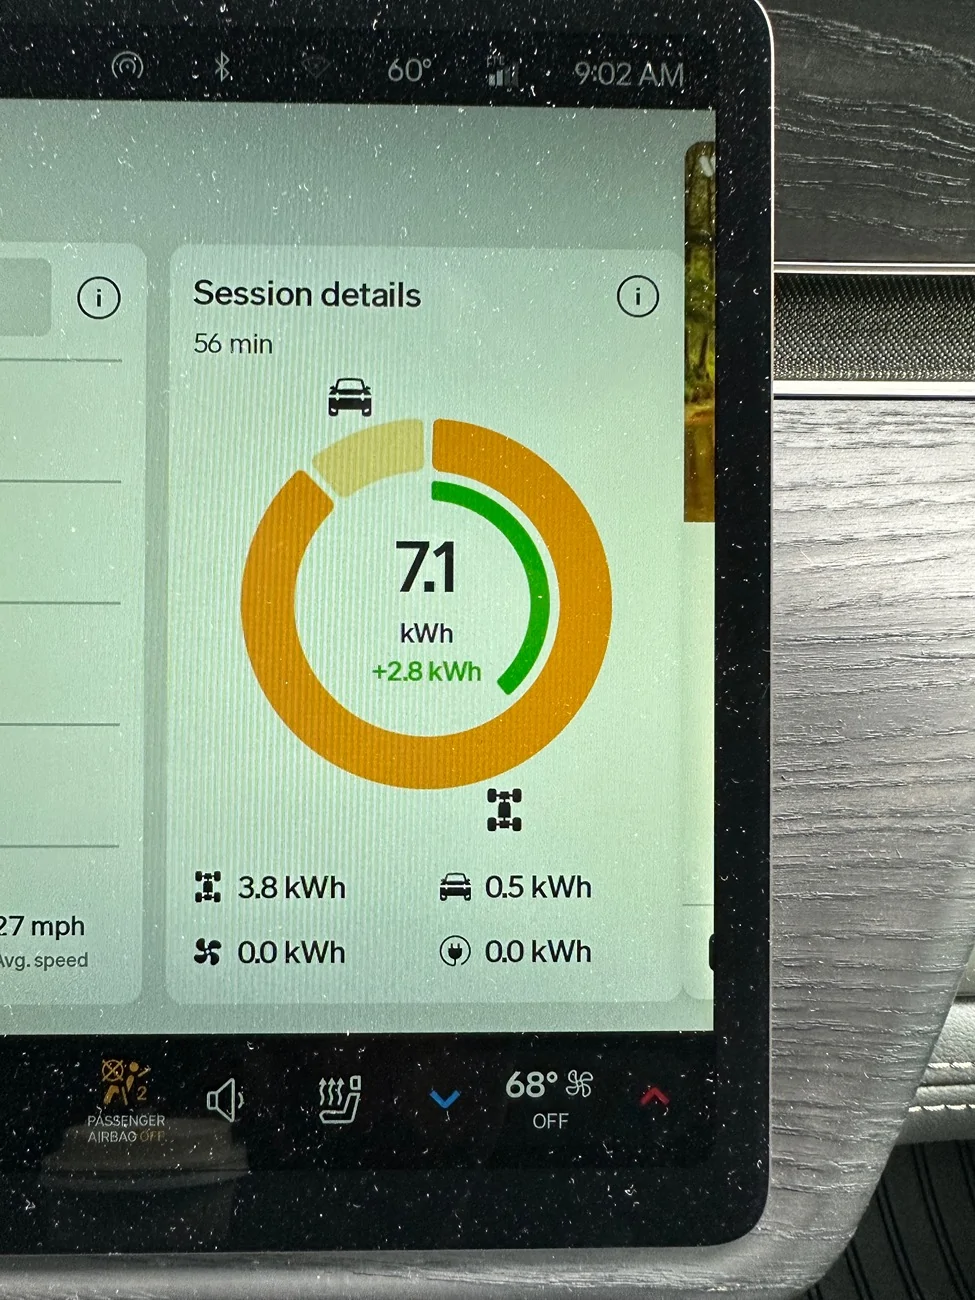
Well I did switch it to kWh but in IMO it still gives a useless value.

I just don’t see the point in displaying energy used plus energy generated? To me it would be far more beneficial to just show you energy used and then perhaps in a separate line
Rivian R1T R1S Energy Monitor Screen - Session Details... Understanding???? IMG_5814
post energy generated. I guess I’m missing something.
 

VSG

Well-Known Member
Joined
Oct 3, 2022
Threads
4
Messages
3,371
Reaction score
6,367
Location
WA
Vehicles
R1T LE/RB/OC/20
I think you're expecting too much. The data in the session details is useful, to me at least. It's not mind-shattering in the amount of detail it reveals, but it does show you a different view of the data that would be hard to see otherwise without doing some math.

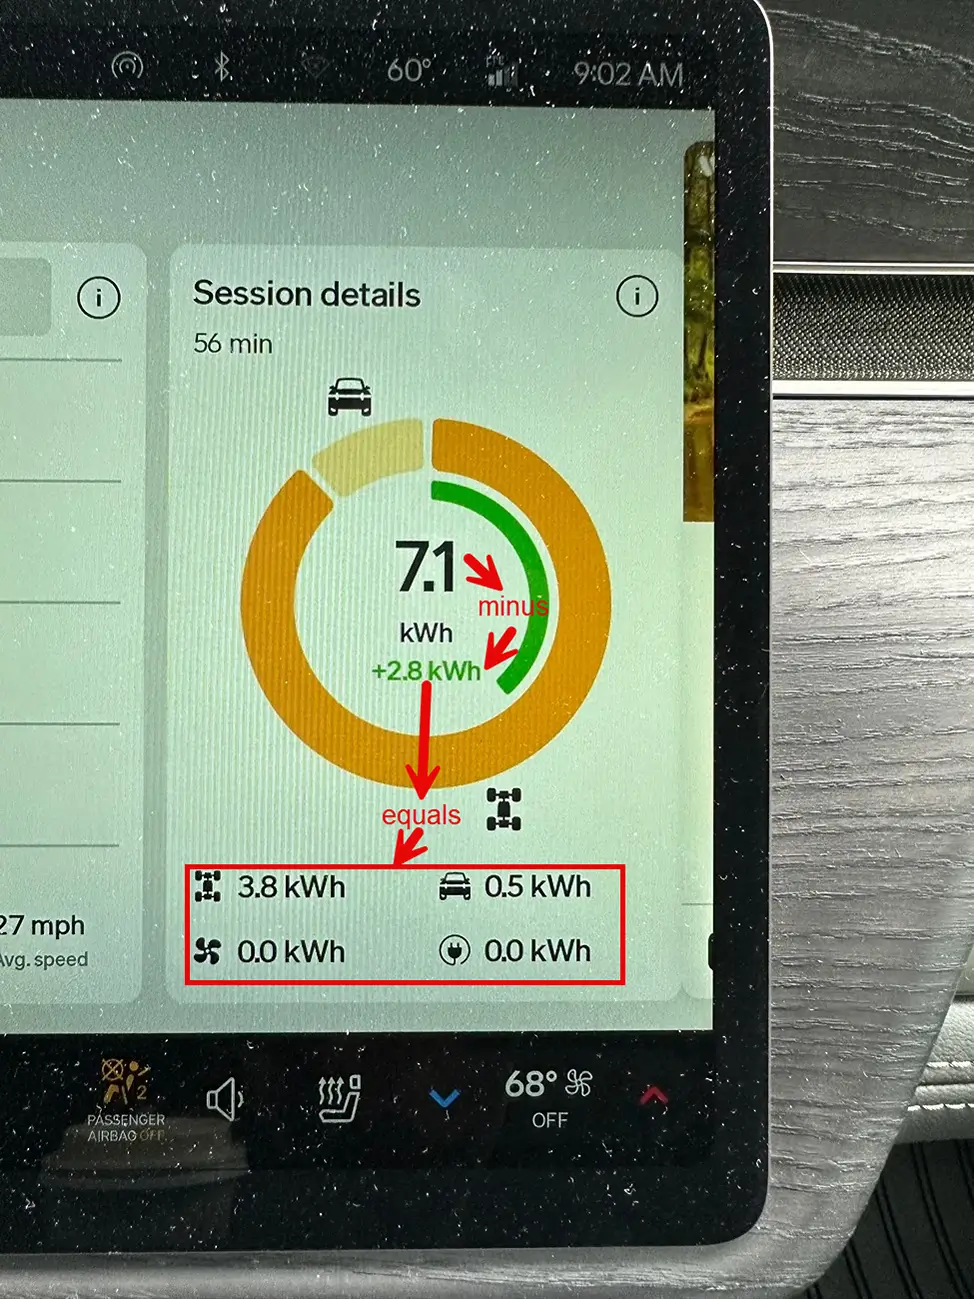
The pie chart shows the total gross energy expended and how it's allocated to the various subsystems. The black number in the center is gross. The green ring and green number shows the energy gained through regenerative braking, on the same scale. The numbers at the bottom are net usages for the various subsystems. The session details pie chart is essentially an integration of the bar chart in the center, for those of us who can't integrate in their head on the fly.

The big takeaway from this graph is how large a factor regenerative braking plays in your overall efficiency. Here it shows you're recovering more than 40% of the energy used to power the drivetrain (you can see this by the relative size of the green arc vs the entire circle). It doesn't always look like this, so this isn't a one-time takeaway, it's information specific to your drive. Likewise, if you had HVAC usage, you could see how much that was affecting your efficiency/range. (Most people on this forum talk about HVAC as a big factor in range, and suggest turning off the HVAC if you're running low on battery, to maximize what you have left. In my experience, this graph tells me that the gain from doing that is minimal - maybe 5% for most of my driving. But that's not true of everyone in every region of the country with every preference for cabin temperature.)
I often compare the actual miles I drove to the predicted range based on SOC at the start and end of my drive. (which is visible on the center display). If the difference between the predicted range at the start and finish of my drive is less than the actual miles I drove, then I at least feel I am ahead of the game 😎.
If you're using the navigation, the predicted remaining range should be very very close to the actual remaining range at the end of your drive, as it is constantly recalculating and converging on the actual number.

If you're talking about comparing the "miles" of range shown on the driver's screen with the actual miles driven, don't do that. The driver's screen "range" is not a prediction of how far you can go, it is merely a "gas gauge" which shows the SoC of your battery multiplied by the EPA range. If you have that number set to "miles", then change it! Go into your settings. You can choose SoC% (which is the actual value it measures) or you can choose to show both SoC% and miles, so you don't have to do rough calculations in your head. But leaving it on miles only is just misleading and deceptive. This number can never be used for predicting, because it has no idea of whether you will be traveling uphill or downhill the whole way (for example). The navigation CAN predict, because it knows the route and the speed limits and the elevation changes etc.
 

Sponsored

VandalSibs

Well-Known Member
First Name
Andrew
Joined
Dec 27, 2023
Threads
16
Messages
1,521
Reaction score
2,653
Location
Eastern Washington State
Website
www.sibulskymusic.com
Vehicles
R1T Dual Motor Large Pack
Occupation
Composer, IT Service Desk Analyst
Clubs
 
Well I did switch it to kWh but in IMO it still gives a useless value.

I just don’t see the point in displaying energy used plus energy generated? To me it would be far more beneficial to just show you energy used and then perhaps in a separate line post energy generated. I guess I’m missing something.
Here's an illustrated version of what @VSG is saying.

Rivian R1T R1S Energy Monitor Screen - Session Details... Understanding???? 1782932996695-b5
 

VSG

Well-Known Member
Joined
Oct 3, 2022
Threads
4
Messages
3,371
Reaction score
6,367
Location
WA
Vehicles
R1T LE/RB/OC/20
Thanks @VandalSibs.

We discussed this in some detail in another thread last year. Perhaps in too much detail. (OK, not perhaps, it was definitely too much detail.) Here's a link to one of my posts, but there's also a lot of other good information in that thread so read it all if you want a deep dive. https://www.rivianforums.com/forum/threads/energy-pie-chart-decoded.48784/#post-846237

But I think unless you want to get really technical, the pie chart is a good way to summarize some broad performance metrics. It would have been nice if Rivian documented exactly what this means, but I don't think it's necessary to do anything other than take this at face value. If you don't find it useful, ignore it, just like I ignore Gary's opinion about my driving in the left panel.
 
OP
OP
BTOR

BTOR

Well-Known Member
First Name
Brad
Joined
Dec 2, 2024
Threads
15
Messages
241
Reaction score
157
Location
PNW
Vehicles
2023 Bolt, 2025 R1S
I think you're expecting too much. The data in the session details is useful, to me at least. It's not mind-shattering in the amount of detail it reveals, but it does show you a different view of the data that would be hard to see otherwise without doing some math.

The pie chart shows the total gross energy expended and how it's allocated to the various subsystems. The black number in the center is gross. The green ring and green number shows the energy gained through regenerative braking, on the same scale. The numbers at the bottom are net usages for the various subsystems. The session details pie chart is essentially an integration of the bar chart in the center, for those of us who can't integrate in their head on the fly.

The big takeaway from this graph is how large a factor regenerative braking plays in your overall efficiency. Here it shows you're recovering more than 40% of the energy used to power the drivetrain (you can see this by the relative size of the green arc vs the entire circle). It doesn't always look like this, so this isn't a one-time takeaway, it's information specific to your drive. Likewise, if you had HVAC usage, you could see how much that was affecting your efficiency/range. (Most people on this forum talk about HVAC as a big factor in range, and suggest turning off the HVAC if you're running low on battery, to maximize what you have left. In my experience, this graph tells me that the gain from doing that is minimal - maybe 5% for most of my driving. But that's not true of everyone in every region of the country with every preference for cabin temperature.)

If you're using the navigation, the predicted remaining range should be very very close to the actual remaining range at the end of your drive, as it is constantly recalculating and converging on the actual number.

If you're talking about comparing the "miles" of range shown on the driver's screen with the actual miles driven, don't do that. The driver's screen "range" is not a prediction of how far you can go, it is merely a "gas gauge" which shows the SoC of your battery multiplied by the EPA range. If you have that number set to "miles", then change it! Go into your settings. You can choose SoC% (which is the actual value it measures) or you can choose to show both SoC% and miles, so you don't have to do rough calculations in your head. But leaving it on miles only is just misleading and deceptive. This number can never be used for predicting, because it has no idea of whether you will be traveling uphill or downhill the whole way (for example). The navigation CAN predict, because it knows the route and the speed limits and the elevation changes etc.
Thanks for taking time to reply. I appreciate all of your feedback 👍.

I'm being a bit facetious when I say I must be missing something. I do understand what each value represents on the energy screen. I just don't understand the point of the black number in the middle of the pie chart. I think you used the term "gross" value. If we are using gross & net, the net value would be much more useful IMO. Net energy being the sum of 4 entities in the red box. I would find that value much more useful. Sure, I can add them up and get the kWh or take the gross value and subtract the regen value. But like you said, perhaps I am expecting too much for what the screen actually is providing.

The value I use for actual miles is Trip Odometer A. I try to remember to reset it each time I drive the vehicle. I then know my actual miles and my running trip efficiency. I can compare that to the predictive miles on the center display. I have it selected to show SoC % and predicted miles. My vehicle has the Max battery. I use 142 kWh = 100% (not sure what the actual useful kWh value is for the Max battery, but I think 142 is close). Assuming 100% = 410 miles, then 2.9 miles/kWh will be your break even efficiency, in theory. It's pretty close. I've tested it multiple times and it is surprising how close it is to the predictive value on the center display or the Nav system (I've used both). And yes, I agree, there are many factors that will have an effect on your efficiency. Air temp/density, wind direction, vehicle speed, terrain, just to name a few.

There is one particular trip I do regularly. It is exactly 72 miles door to door. It is a north/south route. Since I take the same route and drive the same speed each trip, ambient conditions is the primary variable. During the summer, 9 of 10 trips the wind is out of the north blowing south. Having a tail wind makes a big difference as does the headwind on the way back. I also do the trip frequently with my bike on the back (QuikrStuff hitch rack) and interestingly enough, it seems to have no noticeable impact on my efficiency which is excellent, to say the least.
 
  • Like
Reactions: VSG
OP
OP
BTOR

BTOR

Well-Known Member
First Name
Brad
Joined
Dec 2, 2024
Threads
15
Messages
241
Reaction score
157
Location
PNW
Vehicles
2023 Bolt, 2025 R1S
Thanks @VandalSibs.

We discussed this in some detail in another thread last year. Perhaps in too much detail. (OK, not perhaps, it was definitely too much detail.) Here's a link to one of my posts, but there's also a lot of other good information in that thread so read it all if you want a deep dive. https://www.rivianforums.com/forum/threads/energy-pie-chart-decoded.48784/#post-846237

But I think unless you want to get really technical, the pie chart is a good way to summarize some broad performance metrics. It would have been nice if Rivian documented exactly what this means, but I don't think it's necessary to do anything other than take this at face value. If you don't find it useful, ignore it, just like I ignore Gary's opinion about my driving in the left panel.
Thanks @VandalSibs & @VSG for your feedback. I think @VSG put it best..... "take it at face value" and don't overthink it 😎. I'll check out your previous threads. Thanks for including the hypertext.
 

VSG

Well-Known Member
Joined
Oct 3, 2022
Threads
4
Messages
3,371
Reaction score
6,367
Location
WA
Vehicles
R1T LE/RB/OC/20
2.9 miles/kWh will be your break even efficiency
If you're getting 2.9 m/kWh then you're doing really good. I have a lifetime efficiency of 2.25 m/kWh on my Gen 1 R1T, w/20" and as far as I can tell I'm better than most with my configuration. I've seen many people reporting <2.
 
OP
OP
BTOR

BTOR

Well-Known Member
First Name
Brad
Joined
Dec 2, 2024
Threads
15
Messages
241
Reaction score
157
Location
PNW
Vehicles
2023 Bolt, 2025 R1S
If you're getting 2.9 m/kWh then you're doing really good. I have a lifetime efficiency of 2.25 m/kWh on my Gen 1 R1T, w/20" and as far as I can tell I'm better than most with my configuration. I've seen many people reporting <2.
After years of driving a hybrid, you learn how to work it. No hard accelerations and do your best stay close to the speed limit. I use the ACC as much as possible figuring a computer can control my speed much better than I can control my foot.

And don’t get me wrong, I do have trips that are in the 2.6 arena. I rarely see anything < 2.5.
Sponsored


Top