Sponsored

End Charging time is off by 1 hour

AndyPS

Member
First Name
Andy
Joined
Apr 7, 2025
Threads
6
Messages
23
Reaction score
41
Location
Palm Springs, CA, USA
Vehicles
R1S G2
Occupation
Baker
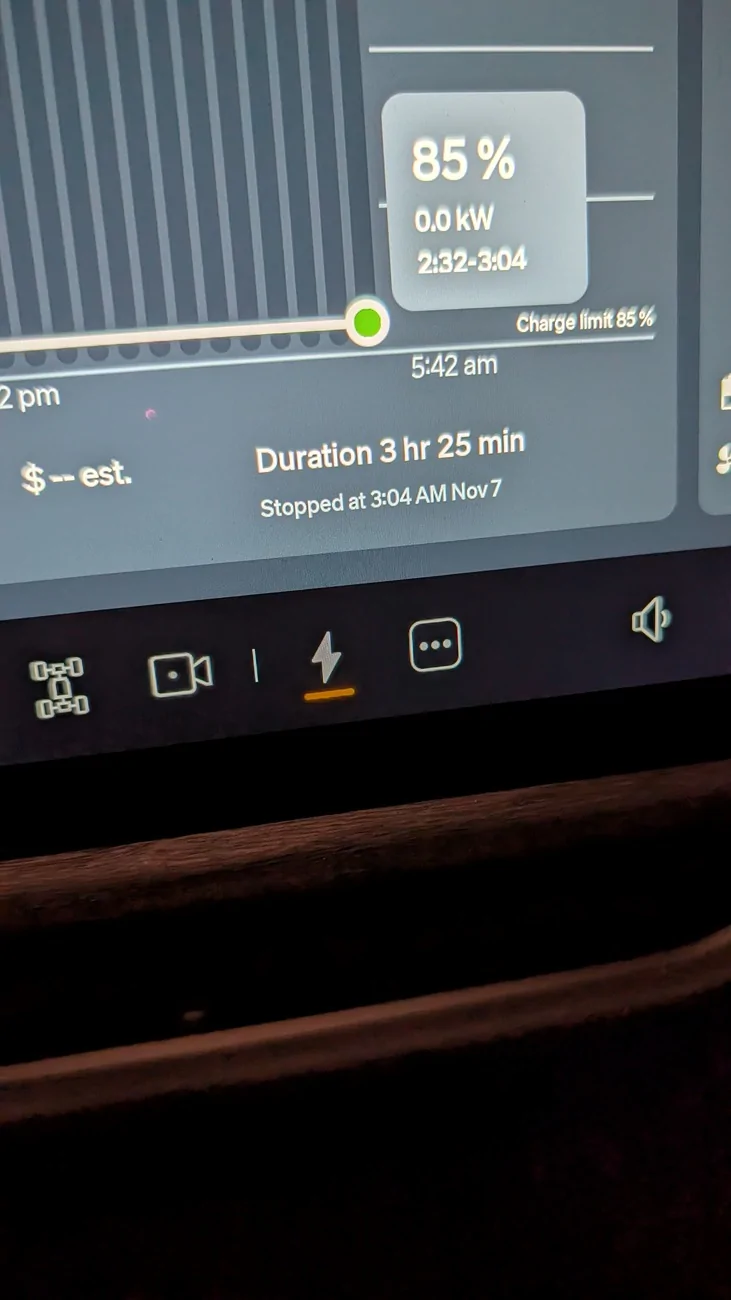
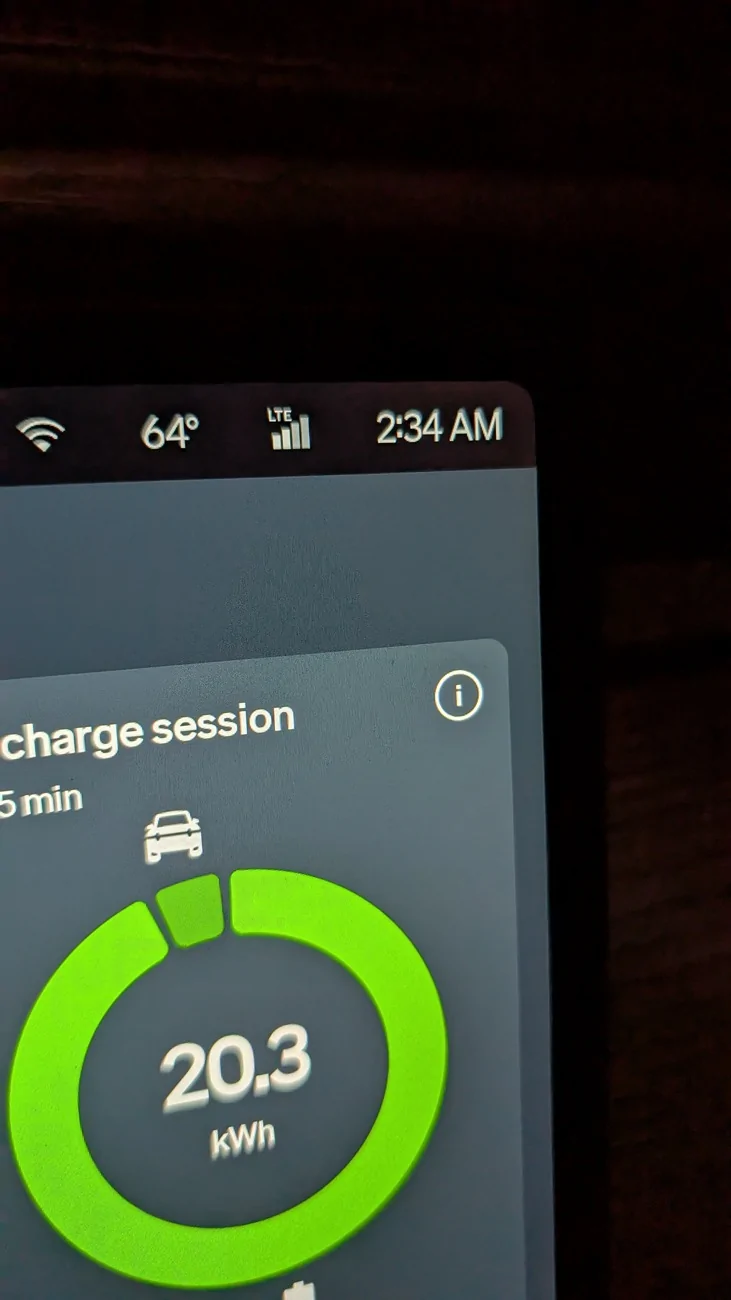
When I went out to my R1S this morning I noticed it stopped charging in the future. The time was off by 1 hour. The car was rebooted yesterday so it should have synced up all the time change stuff.


Rivian R1T R1S End Charging time is off by 1 hour PXL_20251107_103424500
Rivian R1T R1S End Charging time is off by 1 hour PXL_20251107_103428354
Sponsored


VSG

Well-Known Member
Joined
Oct 3, 2022
Threads
4
Messages
3,252
Reaction score
6,079
Location
WA
Vehicles
R1T LE/RB/OC/20
Instead of looking at the data and assuming "wrong" or "bug", I look at the data and try to figure out what it is telling me. And my conclusion is that you've just misinterpreted it.

The graph is a bar chart (historgram), where each bar (bin) represents a time range. Rivian for some reason uses bins of 32 minutes. The data for each time range goes into one bin for that time range. I don't know how many samples of the charging rate are taken in each time range, but the only thing stored in the bin is the sum of all the samples in that range. (In fact it could be only one sample, taken at the end of each time range.) The line drawn on the graph (which you do not show) is simply a smoothed curve drawn between the bin values - it specifically does NOT represent the continuous, up-to-the-second charging rate.

So in your image, the last bin holds data from 0232 to 0304. There were 0.0 kWh added in that period (this is rounded, so there could have been a small amount of energy added. Because of the nature of the graph, all we know is that charging stopped some time in the period between 0234 and 0304. We don't know the exact time. The display shows you the charging stopped at 0304, which is a fine-grained as you're going to get for this number. It appears you looked into your truck at 0234, so we know that the actually stop time was closer to the beginning of the bin (0232) than the end (0304), but Rivian is just telling you that it stopped somewhere in that bin and reporting the end time for that bin. What number would you have them show? You would see a similar "error" if they chose to show the start of the bin or the middle of the bin as the time the charging stopped.

The "problem" is that a histogram is a quantized graph of the data - it is not a continuous graph. So the end time has to also be quantized unless additional data (namely the exact timestamp of the last rate sample) is recorded. Histograms are useful tools, but you have to be aware that due to their nature some of the conclusions you draw from them are affected how the data is binned, and you can come to a wrong conclusion if you don't consider this.

So the only reason it looks wrong to you is that the charging stopped near the start of the bin and you looked at it shortly thereafter, when data for the bin was still being collected. It most certainly is not a case of the clock being off by 1 hour.
 
Last edited:
OP
OP
AndyPS

AndyPS

Member
First Name
Andy
Joined
Apr 7, 2025
Threads
6
Messages
23
Reaction score
41
Location
Palm Springs, CA, USA
Vehicles
R1S G2
Occupation
Baker
Thanks for the explanation. I was just reading the text that caught me, The car was charged up on Nov 6 but stayed plugged in till the 7th. So the stopped at 3:04am Nov 7 just hadn't happened, and I thought the text would mean when I unplugged, not the end of the chart time. Being a previous developer, I get it. Usability department will have to decide if the majority of their drivers will get it too.

Thanks again, I'm good now that I understand.
 
  • Like
Reactions: VSG

VSG

Well-Known Member
Joined
Oct 3, 2022
Threads
4
Messages
3,252
Reaction score
6,079
Location
WA
Vehicles
R1T LE/RB/OC/20
Usability department will have to decide if the majority of their drivers will get it too.
Yeah, it's going to be a tradeoff. Rivian added that energy screen with the graphs recently in response to user demand for more details. But if you present "Stats for nerds", then you're sort of assuming your audience is nerds. Displaying too much information causes an enormous increase in support calls, for example when they added the motor and battery temperature display and all of a sudden people started calling in worrying that motor temperature in the orange meant there was a problem. One guy in this forum even abandoned his Rivian on a bridge on a highway, scared to drive it because the motor temperatures were orange. Rivian had to tow his car hundreds of miles and give him a loaner because he was on a road trip at the time ...
 

UnsungZero_OldTimeAdMan

Well-Known Member
First Name
Barnum
Joined
Mar 20, 2023
Threads
68
Messages
8,701
Reaction score
11,943
Location
SoCal
Vehicles
'23 GW Quad-Large R1T "Ghost"
Occupation
Advertising Circus
Yeah, it's going to be a tradeoff. Rivian added that energy screen with the graphs recently in response to user demand for more details. But if you present "Stats for nerds", then you're sort of assuming your audience is nerds. Displaying too much information causes an enormous increase in support calls, for example when they added the motor and battery temperature display and all of a sudden people started calling in worrying that motor temperature in the orange meant there was a problem. One guy in this forum even abandoned his Rivian on a bridge on a highway, scared to drive it because the motor temperatures were orange. Rivian had to tow his car hundreds of miles and give him a loaner because he was on a road trip at the time ...
Just like when gauge view was introduced and bunch of owners freaked out thinking their cars were overheating. Going back even further, when some customers freaked out upon seeing how hot their cabins were, when parked in the sun, and automatically assumed there was something fundamentally wrong with their new car from a new car company—not realizing every single car is an oven when left out in the sun.
Sponsored


Top