mkhuffman
Well-Known Member
Where does that data come from, how does it mean anything when you don't provide any context?What debate?

Sponsored
Last edited:
Where does that data come from, how does it mean anything when you don't provide any context?What debate?

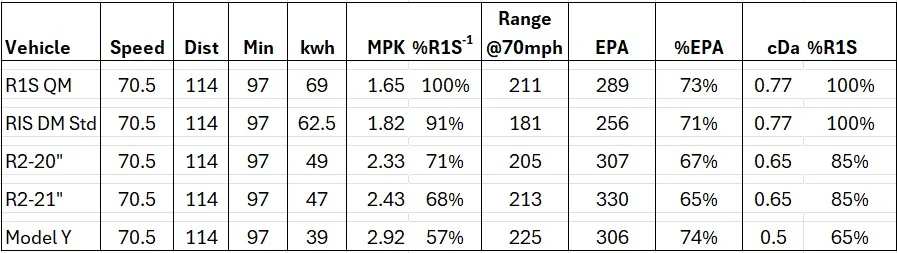
At 70 mph, aerodynamic drag is one of the largest energy demands, so CdA does a surprisingly good job of predicting the relative highway efficiency of the Model Y, R2 and R1S.Where does that data come from, how does it mean anything when you don't provide any context?
Thank you, AI bot. But you didn't answer my question.At 70 mph, aerodynamic drag is one of the largest energy demands, so CdA does a surprisingly good job of predicting the relative highway efficiency of the Model Y, R2 and R1S.
As CdA increases, miles per kWh generally decreases. For example, the R2 has about 32% more CdA than the Model Y, so it must use substantially more energy to push air at the same speed. The R2 also has about 13% less CdA than the R1S, helping explain why it should be more efficient.
To make a meaningful comparison, however, the vehicles must be evaluated under similar conditions. Speed, elevation, temperature, wind, road grade, tires, climate-control use and vehicle load can all materially affect efficiency. Ideally, comparisons should be normalized to the same speed, temperature, elevation and still-air conditions so that differences in mi/kWh are more likely to reflect the vehicles themselves rather than the test environment.

OOS just posted new MY Perf 10% challenge.What debate?
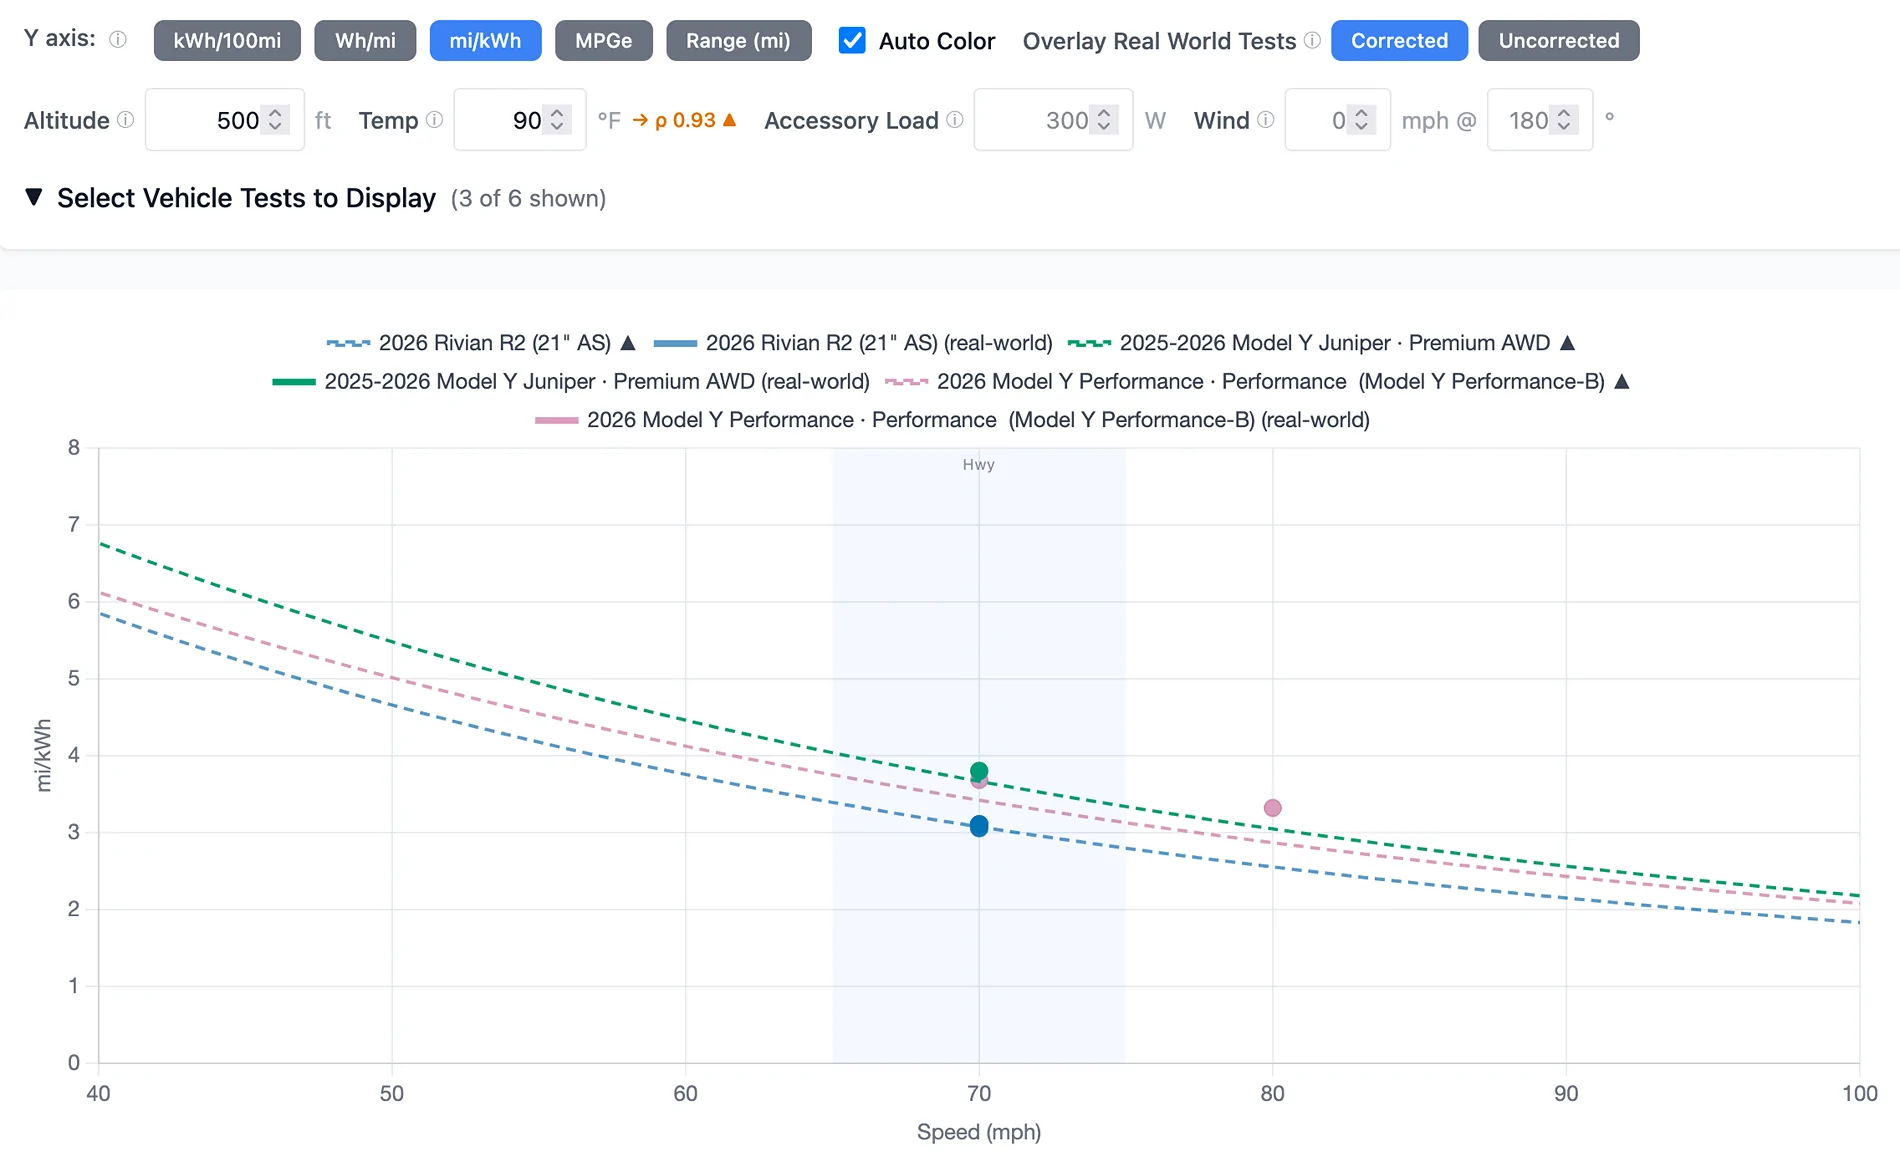
That 3.3 mi/kWh at 80 mph reinforces the key difference the EPA numbers miss. At lower highway speeds, the R2 and Model Y may have similar usable 10–70% road-trip range, but the Model Y holds its efficiency much better as speed rises (~30% lower drag than R2).OOS just posted new MY Perf 10% challenge.
It got 3.3 mpk at 80mph.
Yeah...not surprising. I was hoping R2 would have more mileage than my Model 3 given its bigger battery but the boxy shape will probably be noticeably less for roadtrips. 70mph is not practical for California road trips so the 80mph is a much better indicator. I'm hoping the R2 gets at least 2.7 mpk then at least its getting near 150 miles of range for a 10-70% charge.OOS just posted new MY Perf 10% challenge.
It got 3.3 mpk at 80mph.
| MPK | Range | Speed |
| 3.6 | 315 | 57.0 |
| 3.4 | 300 | 60.0 |
| 3.3 | 290 | 63.0 |
| 3.1 | 275 | 66.5 |
| 3.0 | 264 | 67.0 |
| 2.9 | 251 | 70.0 |
| 2.8 | 250 | 71.0 |
| 2.7 | 238 | 74.0 |
| 2.6 | 225 | 76.5 |
| 2.4 | 212 | 79.0 |
| 2.3 | 200 | 82.0 |
The efficiency of the R2 is 2.6 mi/kWh at 79 mph.Look forward to seeing your results...here's a general idea of what you might expect to see...pretty steep drop off from 63 mph to 82 mph:
MPKRangeSpeed3.631557.03.430060.03.329063.03.127566.53.026467.02.925170.02.825071.02.723874.02.622576.52.421279.02.320082.0
I was seeing less than 2.0 MPK on my own highway test drive, so I have a hard time believing 2.6 MPK at 79 mph in still air is realistic. Even allowing for heavy A/C use, climate control would not explain a 0.6 mi/kWh difference by itself. The only first-hand report near 2.6 MPK also benefited from a 5–10 mph tailwind, so it does not support using 2.6 mi/kWh as a normalized 79 mph benchmark.The efficiency of the R2 is 2.6 mi/kWh at 79 mph.

That 3.3 mi/kWh at 80 mph reinforces the key difference the EPA numbers miss. At lower highway speeds, the R2 and Model Y may have similar usable 10–70% road-trip range, but the Model Y holds its efficiency much better as speed rises (~30% lower drag than R2).
Model Y Performance would still provide at least 130 miles between 10% and 70%, while the R2 may be closer to 100 (or less) miles. The additional high-speed range can affect charger selection, stop frequency, and overall trip time; especially on routes with wider charger spacing.
Look forward to seeing your results...here's a general idea of what you might expect to see...pretty steep drop off from 63 mph to 82 mph:
MPK Range Speed 3.6 315 57.0 3.4 300 60.0 3.3 290 63.0 3.1 275 66.5 3.0 264 67.0 2.9 251 70.0 2.8 250 71.0 2.7 238 74.0 2.6 225 76.5 2.4 212 79.0 2.3 200 82.0