Sponsored

mkhuffman

Well-Known Member
First Name
Mike
Joined
Nov 9, 2020
Threads
14
Messages
3,073
Reaction score
3,525
Location
Virginia
Vehicles
2025 R1T Tri-Max, Jeep GC-L, VW Jetta
I was seeing less than 2.0 MPK on my own highway test drive, so I have a hard time believing 2.6 MPK at 79 mph in still air is realistic. Even allowing for heavy A/C use, climate control would not explain a 0.6 mi/kWh difference by itself. The only first-hand report near 2.6 MPK also benefited from a 5–10 mph tailwind, so it does not support using 2.6 mi/kWh as a normalized 79 mph benchmark.
You need a lot more than one 10-minute highway drive to really determine efficiency. The BMS is estimating SoC. It isn't like a gas tank. A 10-minute drain at highway speed can be impacted by so many things including errors in how much battery was actually used.

You need multiple one-hour+ drives under the same weather conditions (as close as possible, of course). Once you have a data set, you can see what the average mi/kWh is. But you have to have as much control over all the variables that impact efficiency in order to have tests that are consistent enough to provide a good conclusion.

@Budman tests this way. He gets a significant number of drives and plots them on a graph to look for a pattern. In the real world, he does about as good a job as anyone can determining actual efficiency. It takes a lot of effort, and you can't just throw out conclusions after one short test. I mean, you can, and do, but you shouldn't.

OOS does a good job controlling as many variables as possible, with strict controls over how the testing is done. I would prefer they did the test several times instead of once, but at least they are repeating the same test as closely as possible with each vehicle they test.

Edit: the range testing done by C&D and OOS are also good tests because they drive the vehicle at a set speed from 100 to 0%. That is the best way to determine real world range. I am very interested to see how the C&D 75 mph range test turns out.
Sponsored


 

Budman

Well-Known Member
First Name
Rick
Joined
Oct 22, 2021
Threads
60
Messages
864
Reaction score
2,970
Location
Minnesota
Vehicles
Honda CRV
Clubs
 
You need a lot more than one 10-minute highway drive to really determine efficiency. The BMS is estimating SoC. It isn't like a gas tank. A 10-minute drain at highway speed can be impacted by so many things including errors in how much battery was actually used.

You need multiple one-hour+ drives under the same weather conditions (as close as possible, of course). Once you have a data set, you can see what the average mi/kWh is. But you have to have as much control over all the variables that impact efficiency in order to have tests that are consistent enough to provide a good conclusion.

@Budman tests this way. He gets a significant number of drives and plots them on a graph to look for a pattern. In the real world, he does about as good a job as anyone can determining actual efficiency. It takes a lot of effort, and you can't just throw out conclusions after one short test. I mean, you can, and do, but you shouldn't.

OOS does a good job controlling as many variables as possible, with strict controls over how the testing is done. I would prefer they did the test several times instead of once, but at least they are repeating the same test as closely as possible with each vehicle they test.

Edit: the range testing done by C&D and OOS are also good tests because they drive the vehicle at a set speed from 100 to 0%. That is the best way to determine real world range. I am very interested to see how the C&D 75 mph range test turns out.
I'll 2nd the comment that the BMS/Efficiency calculator can do weird things in the short term from time to time that I can't explain.

My efforts and graphs attempt to document the behavior of a few of the factors impacting EV range. Namely temperature, drive modes, tires and different vehicles. I've made little effort to document the effect of speed except to try and state clearly what speed I was traveling at.

A few things I've found have surprised me like the difference between all purpose and conserve modes on the Gen 1 R1T. They behave very differently at different temperatures. Also, the difference between the all season Pirelli and all terrain Nokian's is very different at different temperatures.

While OOS tries to control environmental factors in their testing even a +/- 5 degree temperature difference or a +/- 8 mph wind difference can lead to significant errors in a one-off test. I attempt to smooth out those inevitable errors by taking multiple data points and plotting the regression lines through the data set with the 95% statistical confidence bands shown on the plots.
 
OP
OP
ksurfier

ksurfier

Well-Known Member
First Name
Ken
Joined
Aug 23, 2022
Threads
54
Messages
1,203
Reaction score
1,142
Location
CA
Vehicles
R1S, Tesla
Occupation
Fake Science Lead
Clubs
 
My assessment aligns with the available real-world testing data: efficiency at moderate speeds appears excellent, but the R2’s boxier profile and larger frontal area cause efficiency to decline more sharply at higher highway speeds than in a Tesla Model Y.

I’m not claiming that a single 10-minute drive fully characterizes the vehicle. Short tests are simply useful data points, particularly when they agree with engineering expectations and other independent results. The dashboard’s mi/kWh reading is based on the energy consumed over the distance traveled; it is not calculated from the BMS state-of-charge estimate. SoC uncertainty primarily affects the displayed remaining charge and projected range. A 10-minute run is certainly noisier than a two-hour test, but that does not make the efficiency reading meaningless.

The strongest assessment comes from multiple independent lines of evidence: short controlled drives, longer owner road trips, Out of Spec’s full-range testing adjusted for altitude and conditions, Car and Driver’s 75-mph testing, ABRP calibration data, and broader owner-reported results. When those sources consistently indicate the same speed-dependent pattern, confidence in the conclusion becomes substantially stronger.

I’ve considered a large number of factors to arrive at my conclusions/estimates:
  • The R2 has a substantially larger frontal area than a Model Y.
  • Its drag coefficient is also higher.
  • The resulting CdA is therefore materially higher.
  • Aerodynamic power demand rises roughly with the cube of speed.
  • Small CdA differences become increasingly important above 65–70 mph.
  • The R2 should therefore lose efficiency faster as highway speed increases.
  • At moderate speeds, aerodynamic drag is less dominant.
  • This explains why the R2 can look exceptionally efficient around 55–65 mph.
  • It also explains why the gap versus a Model Y widens around 75–80 mph.
  • Estimated R2 efficiency near 75 mph is roughly in the mid-2 mi/kWh range.
  • Estimated Model Y efficiency near 75 mph is roughly in the mid-to-upper-3 mi/kWh range, depending on version and conditions.
  • Those estimated values are directionally consistent with the vehicles’ relative CdA.
  • Short R2 highway tests have produced results consistent with that range.
  • Longer owner road trips show the same speed-dependent pattern.
  • Higher-speed owner reports generally show noticeably lower efficiency.
  • Lower-speed reports frequently show efficiency above 3 mi/kWh.
  • Out of Spec’s full-range testing supports the broader highway-range estimate.
  • Its results can be considered alongside altitude, temperature and test-speed effects.
  • ABRP calibration data provide another independent source of speed-based consumption information.
  • The R2’s EPA rating does not directly reveal this speed sensitivity.
  • EPA range combines multiple driving conditions rather than representing steady 75-mph travel.
  • A vehicle can therefore have a strong EPA rating while still experiencing a sharper high-speed efficiency decline.
  • Battery size and efficiency must also be evaluated separately.
  • The R2’s smaller battery magnifies the practical effect of high-speed efficiency losses.
  • The difference becomes especially noticeable when using a limited road-trip charging window.
  • A 10–70% charging window may produce similar range at moderate speeds.
  • At 75–80 mph, the Model Y retains more usable miles between charging stops.
  • No single test proves the exact efficiency value.
  • The value comes from the convergence of aerodynamics, short tests, long tests, owner data and controlled range testing.
  • Those independent sources point toward the same overall conclusion.
  • The remaining uncertainty is the precise number, not the direction of the effect.
 

Jeremy3292

Well-Known Member
First Name
Jeremy
Joined
Apr 27, 2026
Threads
6
Messages
883
Reaction score
1,457
Location
South Carolina
Vehicles
R2
My assessment aligns with the available real-world testing data: efficiency at moderate speeds appears excellent, but the R2’s boxier profile and larger frontal area cause efficiency to decline more sharply at higher highway speeds than in a Tesla Model Y.

I’m not claiming that a single 10-minute drive fully characterizes the vehicle. Short tests are simply useful data points, particularly when they agree with engineering expectations and other independent results. The dashboard’s mi/kWh reading is based on the energy consumed over the distance traveled; it is not calculated from the BMS state-of-charge estimate. SoC uncertainty primarily affects the displayed remaining charge and projected range. A 10-minute run is certainly noisier than a two-hour test, but that does not make the efficiency reading meaningless.

The strongest assessment comes from multiple independent lines of evidence: short controlled drives, longer owner road trips, Out of Spec’s full-range testing adjusted for altitude and conditions, Car and Driver’s 75-mph testing, ABRP calibration data, and broader owner-reported results. When those sources consistently indicate the same speed-dependent pattern, confidence in the conclusion becomes substantially stronger.

I’ve considered a large number of factors to arrive at my conclusions/estimates:
  • The R2 has a substantially larger frontal area than a Model Y.
  • Its drag coefficient is also higher.
  • The resulting CdA is therefore materially higher.
  • Aerodynamic power demand rises roughly with the cube of speed.
  • Small CdA differences become increasingly important above 65–70 mph.
  • The R2 should therefore lose efficiency faster as highway speed increases.
  • At moderate speeds, aerodynamic drag is less dominant.
  • This explains why the R2 can look exceptionally efficient around 55–65 mph.
  • It also explains why the gap versus a Model Y widens around 75–80 mph.
  • Estimated R2 efficiency near 75 mph is roughly in the mid-2 mi/kWh range.
  • Estimated Model Y efficiency near 75 mph is roughly in the mid-to-upper-3 mi/kWh range, depending on version and conditions.
  • Those estimated values are directionally consistent with the vehicles’ relative CdA.
  • Short R2 highway tests have produced results consistent with that range.
  • Longer owner road trips show the same speed-dependent pattern.
  • Higher-speed owner reports generally show noticeably lower efficiency.
  • Lower-speed reports frequently show efficiency above 3 mi/kWh.
  • Out of Spec’s full-range testing supports the broader highway-range estimate.
  • Its results can be considered alongside altitude, temperature and test-speed effects.
  • ABRP calibration data provide another independent source of speed-based consumption information.
  • The R2’s EPA rating does not directly reveal this speed sensitivity.
  • EPA range combines multiple driving conditions rather than representing steady 75-mph travel.
  • A vehicle can therefore have a strong EPA rating while still experiencing a sharper high-speed efficiency decline.
  • Battery size and efficiency must also be evaluated separately.
  • The R2’s smaller battery magnifies the practical effect of high-speed efficiency losses.
  • The difference becomes especially noticeable when using a limited road-trip charging window.
  • A 10–70% charging window may produce similar range at moderate speeds.
  • At 75–80 mph, the Model Y retains more usable miles between charging stops.
  • No single test proves the exact efficiency value.
  • The value comes from the convergence of aerodynamics, short tests, long tests, owner data and controlled range testing.
  • Those independent sources point toward the same overall conclusion.
  • The remaining uncertainty is the precise number, not the direction of the effect.
Spare us anymore of your "analysis" please going forward.

Rivian R1T R1S R2 Highway Efficiency Test: 80 MPH vs 70 MPH Changed Everything 1784816498683-hn
 
OP
OP
ksurfier

ksurfier

Well-Known Member
First Name
Ken
Joined
Aug 23, 2022
Threads
54
Messages
1,203
Reaction score
1,142
Location
CA
Vehicles
R1S, Tesla
Occupation
Fake Science Lead
Clubs
 
The door is that way ——> 😂

You can clearly see the relationship in the modeled data:

Model assumptions

This is a simplified steady-speed model using: * Vehicle mass: 5,000 lb
* Rolling-resistance coefficient: 0.009
* Powertrain efficiency: 88%
* Constant accessory load: 0.8 kW
* Air density: 1.204 kg/m³, approximately sea level at 70°F
* Flat road, no wind, constant speed of traffic
Useful comparison points

At 70 mph:
  • CdA 0.55 → about 3.60 MPK
  • CdA 0.65 → about 3.25 MPK
  • CdA 0.75 → about 2.96 MPK
  • CdA 0.85 → about 2.72 MPK
At 80 mph, the differences widen:
  • CdA 0.55 → 3.06 MPK
  • CdA 0.75 → 2.47 MPK
  • CdA 0.85 → 2.25 MPK
 

Sponsored

Jeremy3292

Well-Known Member
First Name
Jeremy
Joined
Apr 27, 2026
Threads
6
Messages
883
Reaction score
1,457
Location
South Carolina
Vehicles
R2
The door is that way ——> 😂

You can clearly see the relationship in the modeled data:

Model assumptions

This is a simplified steady-speed model using: * Vehicle mass: 5,000 lb
* Rolling-resistance coefficient: 0.009
* Powertrain efficiency: 88%
* Constant accessory load: 0.8 kW
* Air density: 1.204 kg/m³, approximately sea level at 70°F
* Flat road, no wind, constant speed of traffic
Useful comparison points

At 70 mph:
  • CdA 0.55 → about 3.60 MPK
  • CdA 0.65 → about 3.25 MPK
  • CdA 0.75 → about 2.96 MPK
  • CdA 0.85 → about 2.72 MPK
At 80 mph, the differences widen:
  • CdA 0.55 → 3.06 MPK
  • CdA 0.75 → 2.47 MPK
  • CdA 0.85 → 2.25 MPK
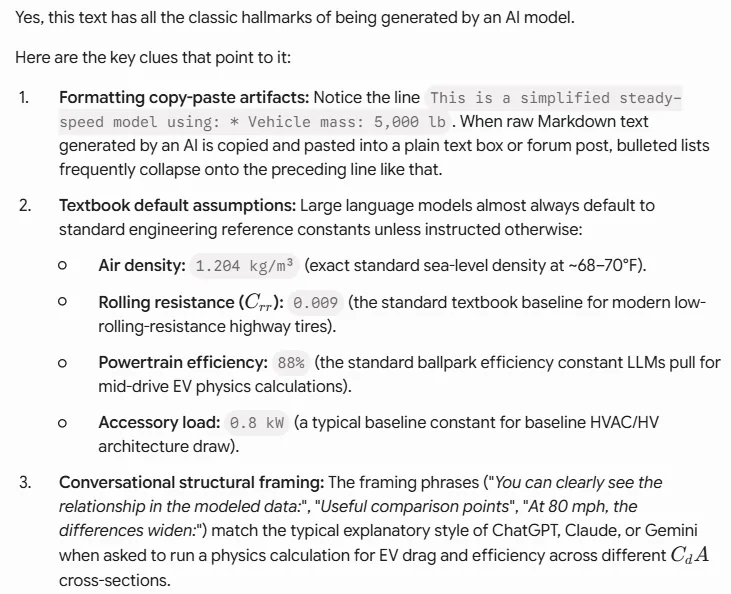
Doubling down, very impressive AI bot.

Rivian R1T R1S R2 Highway Efficiency Test: 80 MPH vs 70 MPH Changed Everything 1784817407910-k4
 

Dave Cundiff

Well-Known Member
First Name
Dave
Joined
Feb 28, 2024
Threads
4
Messages
1,213
Reaction score
1,653
Location
Pacific County, Washington
Vehicles
'23 R1S (DM,Max); '23 R1T (QM,Lg); '23 Chevy Bolt
Doubling down, very impressive AI bot.

1784817407910-k4.webp
@ksurfier is well known and respected here, @Jeremy3292. If you choose to respond, please deal with his arguments and with his conclusions. Please avoid insinuations and personal attacks.

Thanks so much!
 

Jeremy3292

Well-Known Member
First Name
Jeremy
Joined
Apr 27, 2026
Threads
6
Messages
883
Reaction score
1,457
Location
South Carolina
Vehicles
R2
@ksurfier is well known and respected here, @Jeremy3292. If you choose to respond, please deal with his arguments and with his conclusions. Please avoid insinuations and personal attacks.

Thanks so much!
Lol I think you need to catch up to speed, as his posts with personal attacks against me have already been deleted by the mods. I also just proved his posts are AI generated, which is not a personal attack, it is simply just the truth.
 
OP
OP
ksurfier

ksurfier

Well-Known Member
First Name
Ken
Joined
Aug 23, 2022
Threads
54
Messages
1,203
Reaction score
1,142
Location
CA
Vehicles
R1S, Tesla
Occupation
Fake Science Lead
Clubs
 
@ksurfier is well known and respected here, @Jeremy3292. If you choose to respond, please deal with his arguments and with his conclusions. Please avoid insinuations and personal attacks.

Thanks so much!
Thanks Dave, I’ve moved on and am not concerned at all….you know what they say….”Never argue with stupid people, they will drag you down to their level and beat you with experience
 

mkhuffman

Well-Known Member
First Name
Mike
Joined
Nov 9, 2020
Threads
14
Messages
3,073
Reaction score
3,525
Location
Virginia
Vehicles
2025 R1T Tri-Max, Jeep GC-L, VW Jetta
@ksurfier is well known and respected here, @Jeremy3292. If you choose to respond, please deal with his arguments and with his conclusions. Please avoid insinuations and personal attacks.

Thanks so much!
Dave, you are well known and definitely respected in this forum. You are always civil and positive in your engagements. Thank you for being here.

The OP has been here a long time, but in his time here he consistently provides information he claims is factual when it is based on almost nothing substantive. And then to justify his opinions he posts AI content with lots of dubious bullet points and unsubstantiated claims.

I don't mind debating with a human being, but debating with him is debating with an AI bot. He consistently uses that method to respond.

I apologize for getting frustrated, but it's very frustrating and hard not to show it. If his conclusions were based on more than just a 10 minute test, or just weighing a tire, I would appreciate his contributions much more. I'm not the only one who sees what he's doing and gets frustrated by it.

His AI bot actually claims a short drive provides useful data when that just isn't the case. His AI bot claims ABRP is useful input for determining efficiency when is simply not the case. I can continue to refute and debate all the bogus AI bullet points, but it is frustrating to do that. So I won't.
 

Jeremy3292

Well-Known Member
First Name
Jeremy
Joined
Apr 27, 2026
Threads
6
Messages
883
Reaction score
1,457
Location
South Carolina
Vehicles
R2
Dave, you are well known and definitely respected in this forum. You are always civil and positive in your engagements. Thank you for being here.

The OP has been here a long time, but in his time here he consistently provides information he claims is factual when it is based on almost nothing substantive. And then to justify his opinions he posts AI content with lots of dubious bullet points and unsubstantiated claims.

I don't mind debating with a human being, but debating with him is debating with an AI bot. He consistently uses that method to respond.

I apologize for getting frustrated, but it's very frustrating and hard not to show it. If his conclusions were based on more than just a 10 minute test, or just weighing a tire, I would appreciate his contributions much more. I'm not the only one who sees what he's doing and gets frustrated by it.

His AI bot actually claims a short drive provides useful data when that just isn't the case. His AI bot claims ABRP is useful input for determining efficiency when is simply not the case. I can continue to refute and debate all the bogus AI bullet points, but it is frustrating to do that. So I won't.
Eloquently stated and very well summed up.

If anyone takes the time to read through this thread you will see many other well respected people here have attempted to comment and provide input and have been immediately been met with hardline dismissive responses, consistent AI slop shoved on them as if it was truth and factual, and an unyielding willingness to listen or even take note of others. It is infinitely frustrating and prevents from having a good conversation on the topic.

Anyone is welcome to ignore me that's fine, but there are many others here who know a lot and have a lot of data on the matter and they were continually dismissed and then they simply stopped posting bc it was a fruitless endeavor.
Sponsored


Top