Sponsored

Jeremy3292

Well-Known Member
First Name
Jeremy
Joined
Apr 27, 2026
Threads
6
Messages
843
Reaction score
1,384
Location
South Carolina
Vehicles
R2
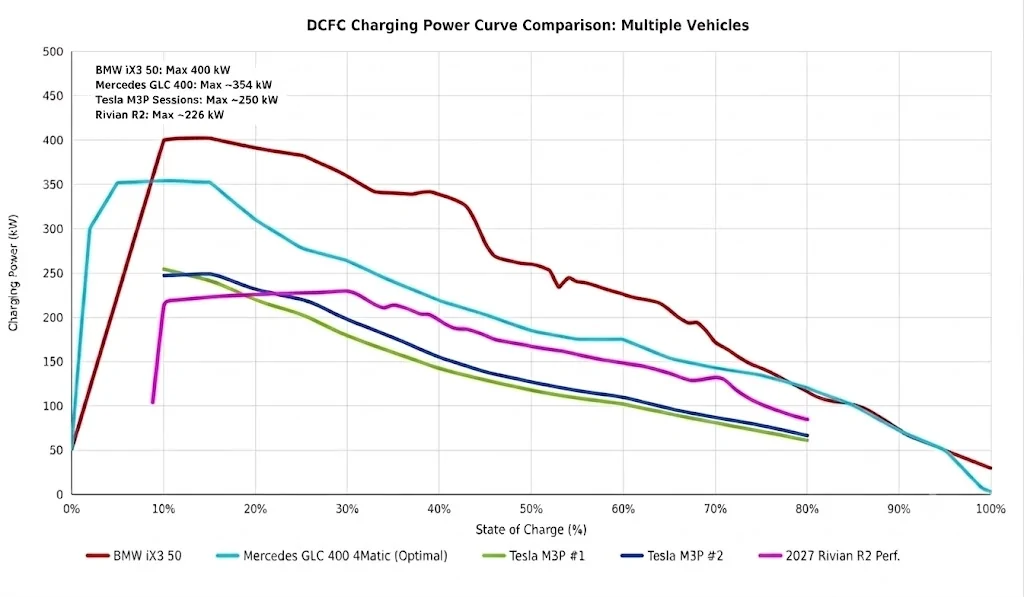
I've been interested in the differences between R2 and Tesla charging curves. Over the least few weeks, I've done some 10% to 80% sessions at a V4 supercharger (posts) with my 2024 Model 3 Performance (Highland) at 8am before it got hot, so no derating. I plotted them on the graph below using the R2 curve from Tom at SOC. I imagine this would be the same charging curve for Model Y as they share the exact same cells, sans the new MYP.

It is interesting to see this in a graphic visual. It confirms that R2 has a much better curve and also charges quicker than Tesla. The area under the curve for Tesla is crazy. It took a few seconds under 30 minutes each time for the Model 3 for 10% to 80%. R2 did it in just under 27 minutes per Tom. Model 3 took 23 minutes for 10% to 70%, R2 did it in 20 minutes. That might not seem like a lot but shaving a few minutes off is a very big deal from an engineering and thermal perspective. Lest we also forget R2 has an 11-12% larger battery too, so one would think the Model 3 could/would charge quicker - or at the very minimum be the same - but it's worse. This shows how good R2 thermals are coupled with the 4695 tabless cells for better heat dissipation

Yes, we all know it is not 800v. We don't need to bring that up anymore. The point is the R2 is still very capable, very good, and beats out its main competition which is Tesla.

Rivian R1T R1S R2 vs Tesla Charging Curve Comparison 1784573943310-l5
Sponsored

 
Last edited:

MountainBikeDude

Well-Known Member
First Name
Adam
Joined
Jun 20, 2019
Threads
55
Messages
3,354
Reaction score
7,154
Location
Vancouver
Vehicles
2023 El Cap Quad Motor R1T (Selling the Xterra)
Clubs
 
I've been interested in the differences between R2 and Tesla charging curves. Over the least few weeks, I've done some 10% to 80% sessions at a V4 supercharger (posts) with my 2024 Model 3 Performance (Highland) at 8am before it got hot, so no derating. I plotted them on the graph below using the R2 curve from Tom at SOC. I imagine this would be the same charging curve for Model Y as they share the exact same cells, sans the new MYP.

It is interesting to see this in a graphic visual. It confirms that R2 has a much better curve and also charges quicker than Tesla. The area under the curve for Tesla is crazy. It took a few seconds under 30 minutes each time for the Model 3 for 10% to 80%. R2 did it in just under 27 minutes per Tom. Model 3 took 23 minutes for 10% to 70%, R2 did it in 20 minutes. That might not seem like a lot but shaving a few minutes off is a very big deal from an engineering and thermal perspective. Lest we also forget R2 has an 11-12% larger battery too, so one would think the Model 3 could/would charge quicker - or at the very minimum be the same - but it's worse. This shows how good R2 thermals are coupled with the 4695 tabless cells for better heat dissipation

Yes, we all know it is not 800v. We don't need to bring that up anymore. The point is the R2 is still very capable, very good, and beats out its main competition which is Tesla.
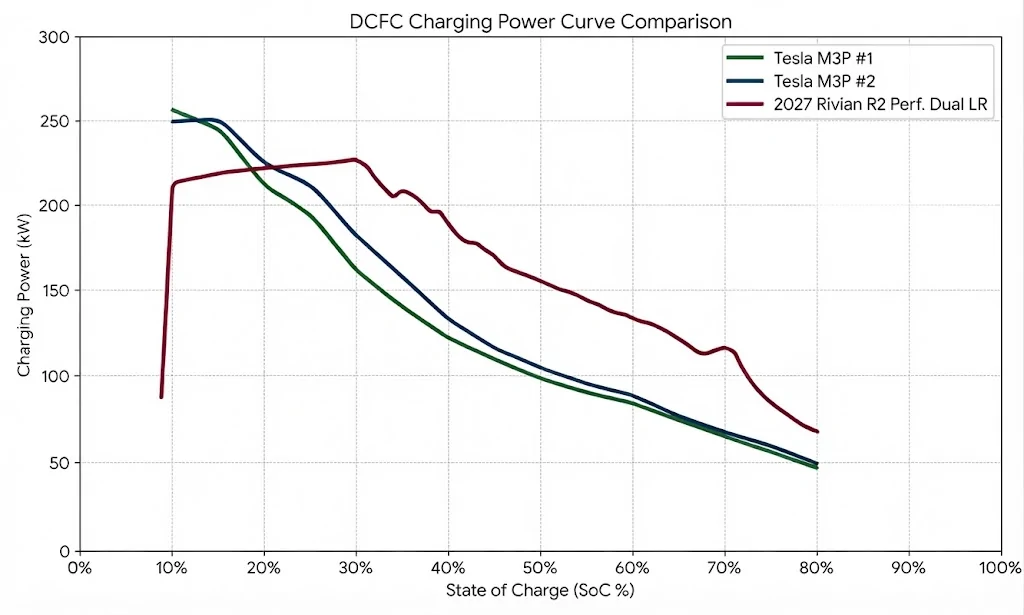
Note: the plots on the graphs may be off ever so slightly, so don't read too much into exact points.

View attachment 160959
The data I'm also interested in is the R2's ability to handle a lengthy road trip with back to to back DCFC deep charge, and discharge cycles. Complete edge case for 95% of owners, but still interesting.

We'll have to wait for Kyle for those tests. I'm sure he'll pit the Model Y Dual motor with the R2 launch and do a 1000mile road trip to see which edges out the other.
 

CharonPDX

Well-Known Member
First Name
Charon
Joined
Jul 12, 2021
Threads
32
Messages
2,610
Reaction score
4,416
Location
Cascadia
Vehicles
'22 R1T LE, '16 Model S, '19 Arcimoto FUV
Occupation
InfoSec Geek
Clubs
 
Some back-of-the envelope math, it looks like "starting at 10%", R2 crosses M3 in "total energy delivered" at about 25%. Which means if both vehicles plug in at 10%, once they reach 25%, the Rivian is by far adding more energy quicker.

Since MY should have similar charge curve, that bodes well for R2 road tripping vs. MY.
 

RickRivian

Well-Known Member
Joined
Dec 16, 2025
Threads
1
Messages
62
Reaction score
68
Location
SE MI
Vehicles
'22 Lightning ER Lariat,'22 Mach-E Premium 4X
What's interesting to me is the charging curve and the range. Comparing 10 to 80% curves on two different vehicles with different range isn't really interesting. What's interesting is minutes per mile driven, i.e. if I charge from 10 to 80% in 25 minutes, and can now drive 250 miles to 10% again, that's 10 miles per minute of charging. If another vehicle takes 30 minutes to do that charge, but give me 300 miles of range, then I am somewhat ambivalent about the charging curve. Hope that makes sense.

My Lightning's battery is 44% bigger than my Mach-E's battery. It charges faster than the Mach-E. BUT, both vehicles have the same range due to the Lightning's lower efficiency. So, if they take the same amount of time to reach 80%, then I would be ambivalent.
 

justinkitswa

Well-Known Member
First Name
Justin
Joined
Apr 18, 2025
Threads
5
Messages
99
Reaction score
181
Location
Western Washington State
Vehicles
R1S
The charging rate of any lithium based battery is based on so many things we can't see. Individual cell state of change, impedance, temperature, voltage. Vehicle thermal load. DC busway temperature. Connector temperature. Available DC current from the AC-DC converter at the charging station, the thermal condition of that system. Charging cable temperature. Available AC current at the charging location. Power factor of the AC-DC converter (if the utility imposes var limits)

The same vehicle, at the same beginning state of charge, at the same time of day, at the same ambient conditions, at the same charging station will yield different results.

It's good that in this instance the R2 curve pulled a few more kw peak over time, but it's too variable to draw conclusions from this.

The only things that matter - 1) Can the vehicle charge quickly enough to be usable for road trips (typically %10 t0 %80 charge time) 2) Can I find enough chargers where I don't have to wait too long to charge? 3) Charging logistics - is the charging station far out of the way, in a bad spot, have amenities like a restroom/coffee/food.

A minute or two more to charge I don't think matters all that much.
 

Sponsored

CharonPDX

Well-Known Member
First Name
Charon
Joined
Jul 12, 2021
Threads
32
Messages
2,610
Reaction score
4,416
Location
Cascadia
Vehicles
'22 R1T LE, '16 Model S, '19 Arcimoto FUV
Occupation
InfoSec Geek
Clubs
 
What's interesting is minutes per mile driven, i.e. if I charge from 10 to 80% in 25 minutes, and can now drive 250 miles to 10% again, that's 10 miles per minute of charging.
That's the crux of @OutofSpecKyle's "10% challenge" series. https://outofspecstudios.com/10-challenge
  • Start at 10%, with preconditioning going.
  • Charge for 15 minutes.
  • Drive at 80 MPH until it drops to 10% again.
  • Record distance driven.
I'd like to see one at 70 MPH, too, since there's plenty of the country that 80 MPH simply isn't feasible, but 80 MPH is what they're using.
 
OP
OP
Jeremy3292

Jeremy3292

Well-Known Member
First Name
Jeremy
Joined
Apr 27, 2026
Threads
6
Messages
843
Reaction score
1,384
Location
South Carolina
Vehicles
R2
The only things that matter - 1) Can the vehicle charge quickly enough to be usable for road trips (typically %10 t0 %80 charge time) 2) Can I find enough chargers where I don't have to wait too long to charge? 3) Charging logistics - is the charging station far out of the way, in a bad spot, have amenities like a restroom/coffee/food.

A minute or two more to charge I don't think matters all that much.
While I agree with your sentiment bc both R2 and Model 3/y meet your 1,2,3 requirements, it does matter to a lot to people who insist on getting charging speeds faster. 3-4 minutes better doesn't feel like a lot, but when you're sitting waiting to go after peeing and maybe getting a bite to eat it seems like an eternity. Otherwise we don't need to get to 15 minute 10% to 80% charging bc we already have it "good enough." The problem with that is "good enough" varies greatly in the eyes of the beholder.
 
OP
OP
Jeremy3292

Jeremy3292

Well-Known Member
First Name
Jeremy
Joined
Apr 27, 2026
Threads
6
Messages
843
Reaction score
1,384
Location
South Carolina
Vehicles
R2
What's interesting to me is the charging curve and the range. Comparing 10 to 80% curves on two different vehicles with different range isn't really interesting. What's interesting is minutes per mile driven, i.e. if I charge from 10 to 80% in 25 minutes, and can now drive 250 miles to 10% again, that's 10 miles per minute of charging. If another vehicle takes 30 minutes to do that charge, but give me 300 miles of range, then I am somewhat ambivalent about the charging curve. Hope that makes sense.

My Lightning's battery is 44% bigger than my Mach-E's battery. It charges faster than the Mach-E. BUT, both vehicles have the same range due to the Lightning's lower efficiency. So, if they take the same amount of time to reach 80%, then I would be ambivalent.
This does make sense but this scenario will almost always favor huge battery packs every time, bc the extra range from the big battery trumps the slightly longer charge times. The comparison I am giving in this thread though is like vehicle vs like vehicle and R2 is superior.
 

RickRivian

Well-Known Member
Joined
Dec 16, 2025
Threads
1
Messages
62
Reaction score
68
Location
SE MI
Vehicles
'22 Lightning ER Lariat,'22 Mach-E Premium 4X
While I agree with your sentiment bc both R2 and Model 3/y meet your 1,2,3 requirements, it does matter to a lot to people who insist on getting charging speeds faster. 3-4 minutes better doesn't feel like a lot, but when you're sitting waiting to go after peeing and maybe getting a bite to eat it seems like an eternity. Otherwise we don't need to get to 15 minute 10% to 80% charging bc we already have it "good enough." The problem with that is "good enough" varies greatly in the eyes of the beholder.
For me it's charging time. When we do trips, we charge 3 or so times a day, then once overnight or before bed depending on whether the hotel has charging or not. If my charging stops are 40 minutes, but they could be 20 minutes, that's an hour a day saved. We recently did a 5,400+ mile trip over nearly 4 weeks, charging over 40 times. If I saved 15 minutes per charging session, over 40 sessions I saved 10 hours. THAT is what I am interested in, not whether my 30 minutes stop is now 27 minutes.
 

TexasBob

Well-Known Member
First Name
Bob
Joined
Jan 15, 2022
Threads
50
Messages
1,286
Reaction score
2,900
Location
Houston
Vehicles
2024 R1T DM LRG, 2025 R1S Dune
I've been interested in the differences between R2 and Tesla charging curves. Over the least few weeks, I've done some 10% to 80% sessions at a V4 supercharger (posts) with my 2024 Model 3 Performance (Highland) at 8am before it got hot, so no derating. I plotted them on the graph below using the R2 curve from Tom at SOC. I imagine this would be the same charging curve for Model Y as they share the exact same cells, sans the new MYP.

It is interesting to see this in a graphic visual. It confirms that R2 has a much better curve and also charges quicker than Tesla. The area under the curve for Tesla is crazy. It took a few seconds under 30 minutes each time for the Model 3 for 10% to 80%. R2 did it in just under 27 minutes per Tom. Model 3 took 23 minutes for 10% to 70%, R2 did it in 20 minutes. That might not seem like a lot but shaving a few minutes off is a very big deal from an engineering and thermal perspective. Lest we also forget R2 has an 11-12% larger battery too, so one would think the Model 3 could/would charge quicker - or at the very minimum be the same - but it's worse. This shows how good R2 thermals are coupled with the 4695 tabless cells for better heat dissipation

Yes, we all know it is not 800v. We don't need to bring that up anymore. The point is the R2 is still very capable, very good, and beats out its main competition which is Tesla.

Note: the plots on the graphs may be off ever so slightly, so don't read too much into exact points.

View attachment 160959
Why is 70% on the x axis twice? I was trying to map other vehicles onto this and a little confusing
 

Sponsored

VSG

Well-Known Member
Joined
Oct 3, 2022
Threads
4
Messages
3,371
Reaction score
6,367
Location
WA
Vehicles
R1T LE/RB/OC/20
Why is 70% on the x axis twice? I was trying to map other vehicles onto this and a little confusing
Funny. Looks like AI slop. There's also a problem with the width of the grid squares around 20% and 50%.

Also, 6 divisions per 10%? So 1.7% per division? That's not wrong, but it's also not what a person would choose. And between the second 70% and 80% it's only 5 divisions not 6 like everywhere else...

Regardless, the shapes of the curves are qualitatively correct.

It would be nice to see the R1 curve on there too - the R1 is similar to but better than the R2, because the R1 holds >200kW all the way up to 50% before dropping off. In my R1 I usually stop charging when the rate drops below 100kW, which usually happens around 75%, just like the R2. That takes longer in the R1 than in the R2 because the R1 battery is so much larger.
 

TexasBob

Well-Known Member
First Name
Bob
Joined
Jan 15, 2022
Threads
50
Messages
1,286
Reaction score
2,900
Location
Houston
Vehicles
2024 R1T DM LRG, 2025 R1S Dune
Funny. Looks like AI slop. There's also a problem with the width of the grid squares around 20% and 50%.

Also, 6 divisions per 10%? So 1.7% per division? That's not wrong, but it's also not what a person would choose. And between the second 70% and 80% it's only 5 divisions not 6 like everywhere else...

Regardless, the shapes of the curves are qualitatively correct.

It would be nice to see the R1 curve on there too - the R1 is similar to but better than the R2, because the R1 holds >200kW all the way up to 50% before dropping off. In my R1 I usually stop charging when the rate drops below 100kW, which usually happens around 75%, just like the R2. That takes longer in the R1 than in the R2 because the R1 battery is so much larger.
We've all fallen victim to Microslop (rule #1 of the AI era, co-pilot is not really ai).

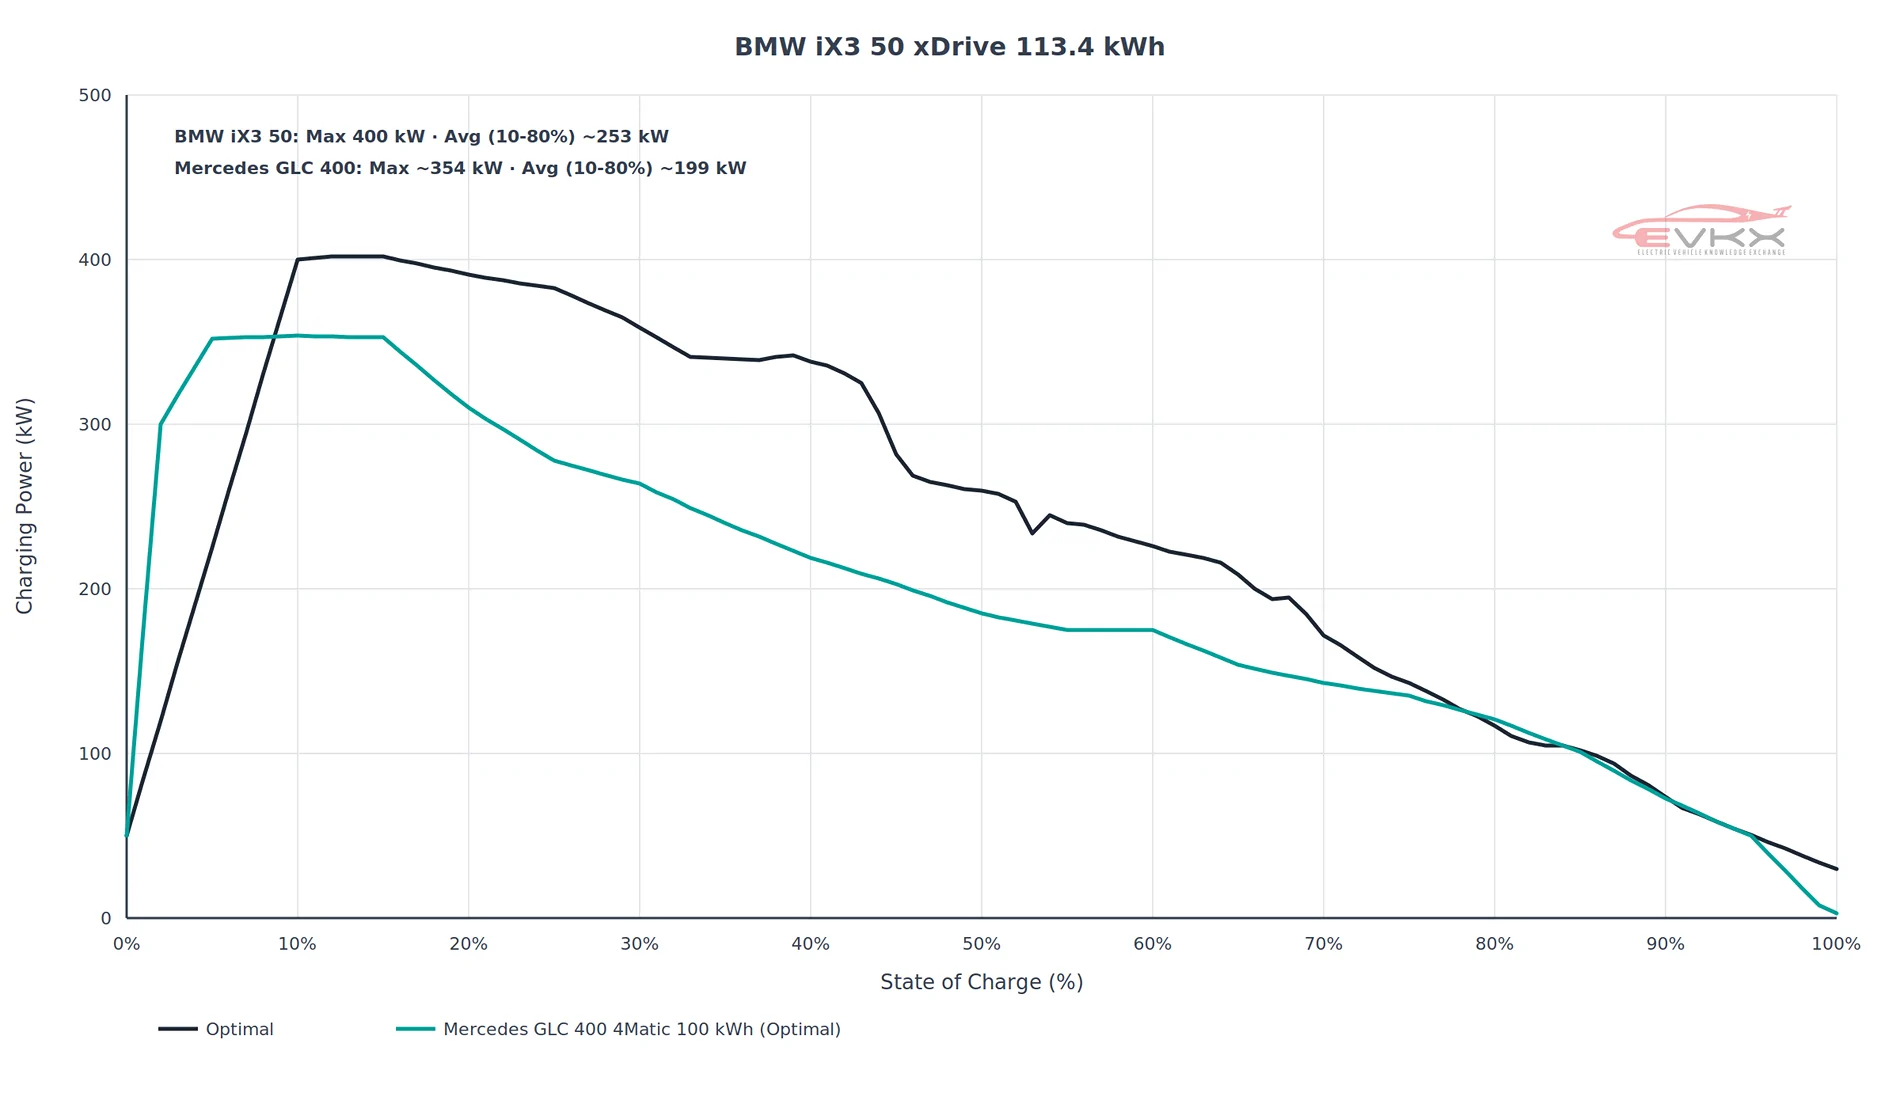
Worth comparing if the R2 data gets sorted are these two competitors.

Rivian R1T R1S R2 vs Tesla Charging Curve Comparison iX3_vs_GLC_charging
 
OP
OP
Jeremy3292

Jeremy3292

Well-Known Member
First Name
Jeremy
Joined
Apr 27, 2026
Threads
6
Messages
843
Reaction score
1,384
Location
South Carolina
Vehicles
R2
We've all fallen victim to Microslop (rule #1 of the AI era, co-pilot is not really ai).

Worth comparing if the R2 data gets sorted are these two competitors.

iX3_vs_GLC_charging.webp
Updated original post, my bad. Added your charts to the below. Ironically the BMW looks so much better on the graph below but still takes ~21 minutes 10 to 80%.

Rivian R1T R1S R2 vs Tesla Charging Curve Comparison 1784574656141-ma
 
OP
OP
Jeremy3292

Jeremy3292

Well-Known Member
First Name
Jeremy
Joined
Apr 27, 2026
Threads
6
Messages
843
Reaction score
1,384
Location
South Carolina
Vehicles
R2
Funny. Looks like AI slop. There's also a problem with the width of the grid squares around 20% and 50%.

Also, 6 divisions per 10%? So 1.7% per division? That's not wrong, but it's also not what a person would choose. And between the second 70% and 80% it's only 5 divisions not 6 like everywhere else...

Regardless, the shapes of the curves are qualitatively correct.

It would be nice to see the R1 curve on there too - the R1 is similar to but better than the R2, because the R1 holds >200kW all the way up to 50% before dropping off. In my R1 I usually stop charging when the rate drops below 100kW, which usually happens around 75%, just like the R2. That takes longer in the R1 than in the R2 because the R1 battery is so much larger.
My bad, fixed. R1 has such a large battery pack compared to R2 (141 kwh vs 88 kWh) it will hold 200kW to about 50% where as R2 holds 150kW to 50%. C rate shows how much better the cells and thermals are on R2. Can do at 30% also for peak rates and it's an even bigger disparity.

50%:
200kW/141kWh=1.42C
150kW/88kWh=1.70C

30%:
~215kW/141kWh=1.52C
226kW/88kWh=2.57C
 

blipit

Well-Known Member
Joined
Feb 7, 2026
Threads
0
Messages
185
Reaction score
244
Location
Dallas
Vehicles
R1T
We've all fallen victim to Microslop (rule #1 of the AI era, co-pilot is not really ai).

Worth comparing if the R2 data gets sorted are these two competitors.

iX3_vs_GLC_charging.webp
Now that is current gen charging specs. Looking forward to seeing them tested stateside. Germans on a roll.

Not entirely interested in comparing R2 to what is essentially Model 3 battery tech that launched 10 years ago.

The only thing really keeping Tesla tech relevant is their efficiency.
Sponsored


Top