CO-Ed
Well-Known Member
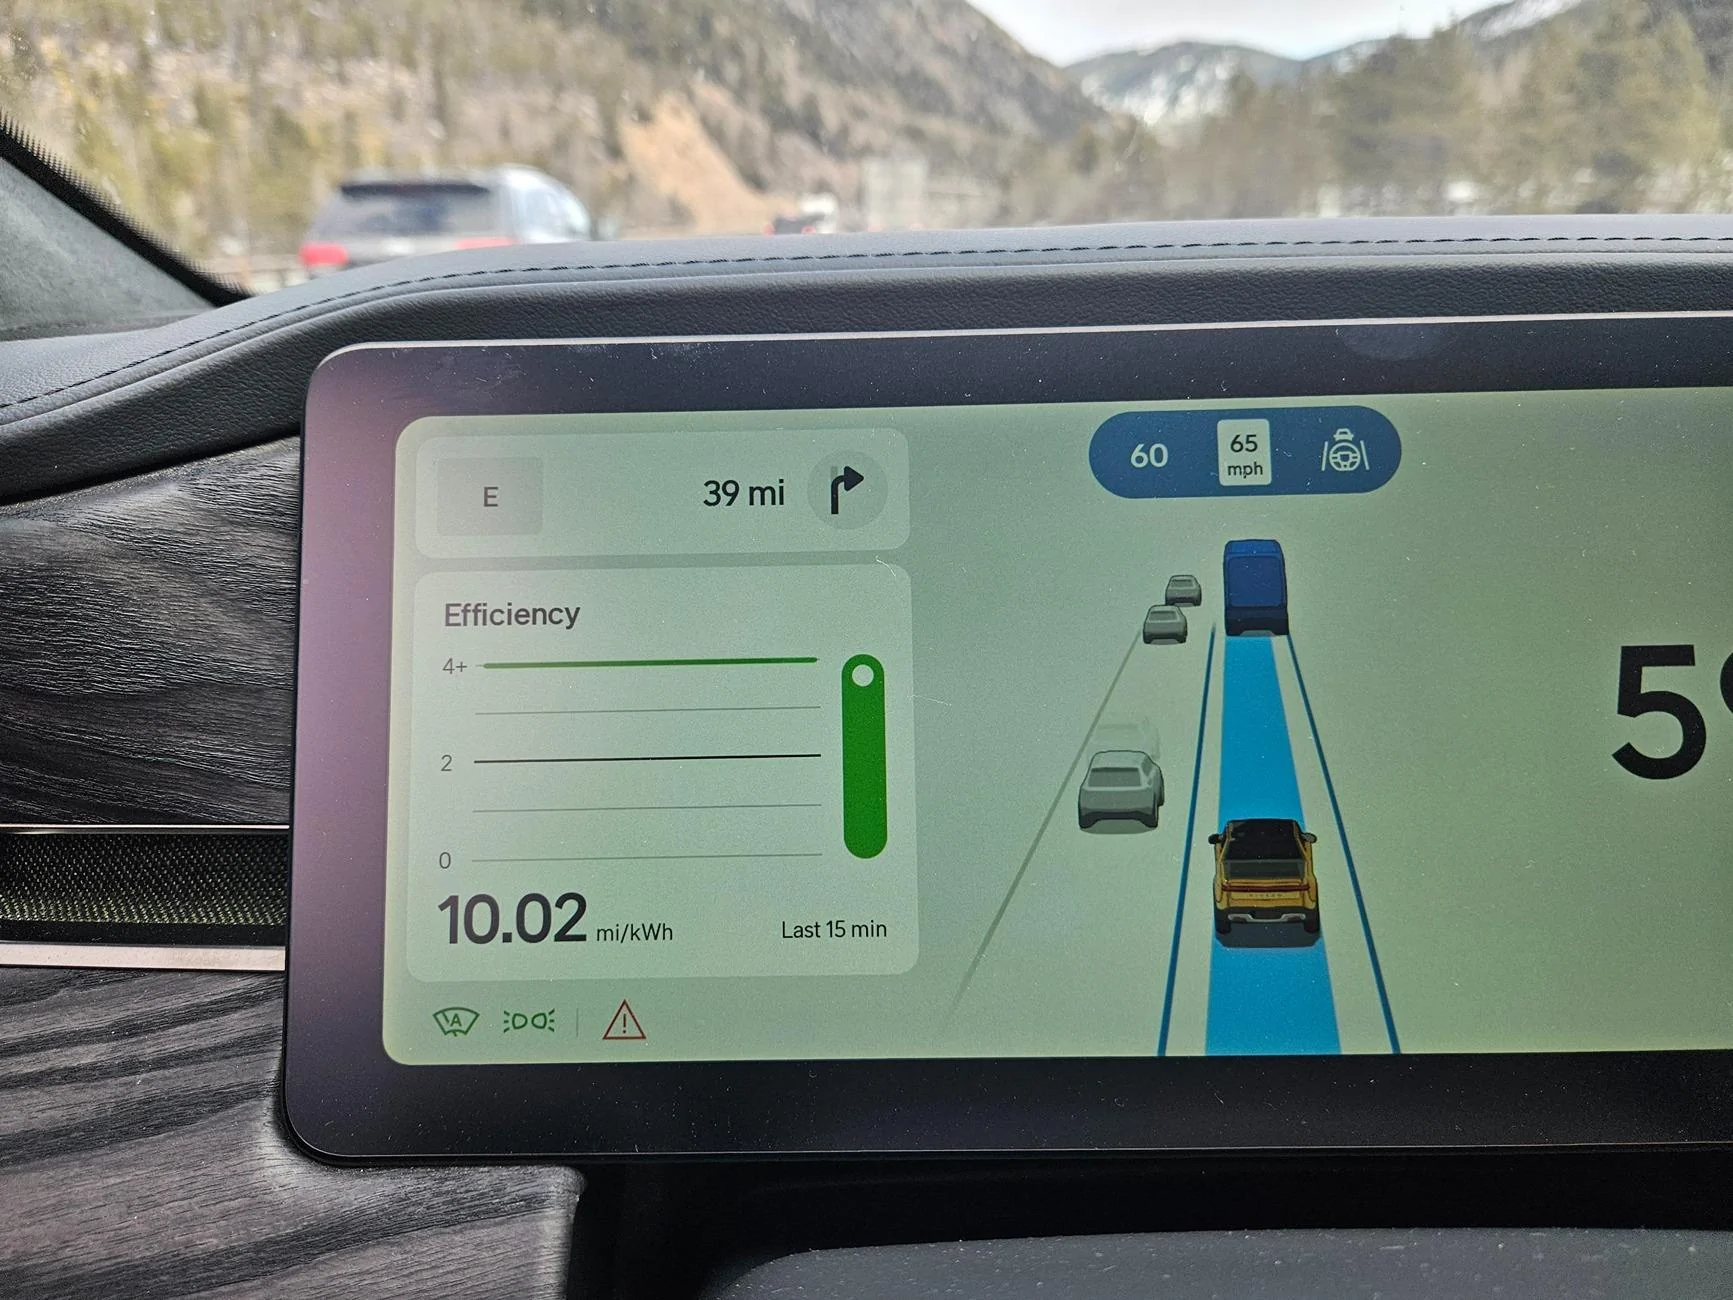
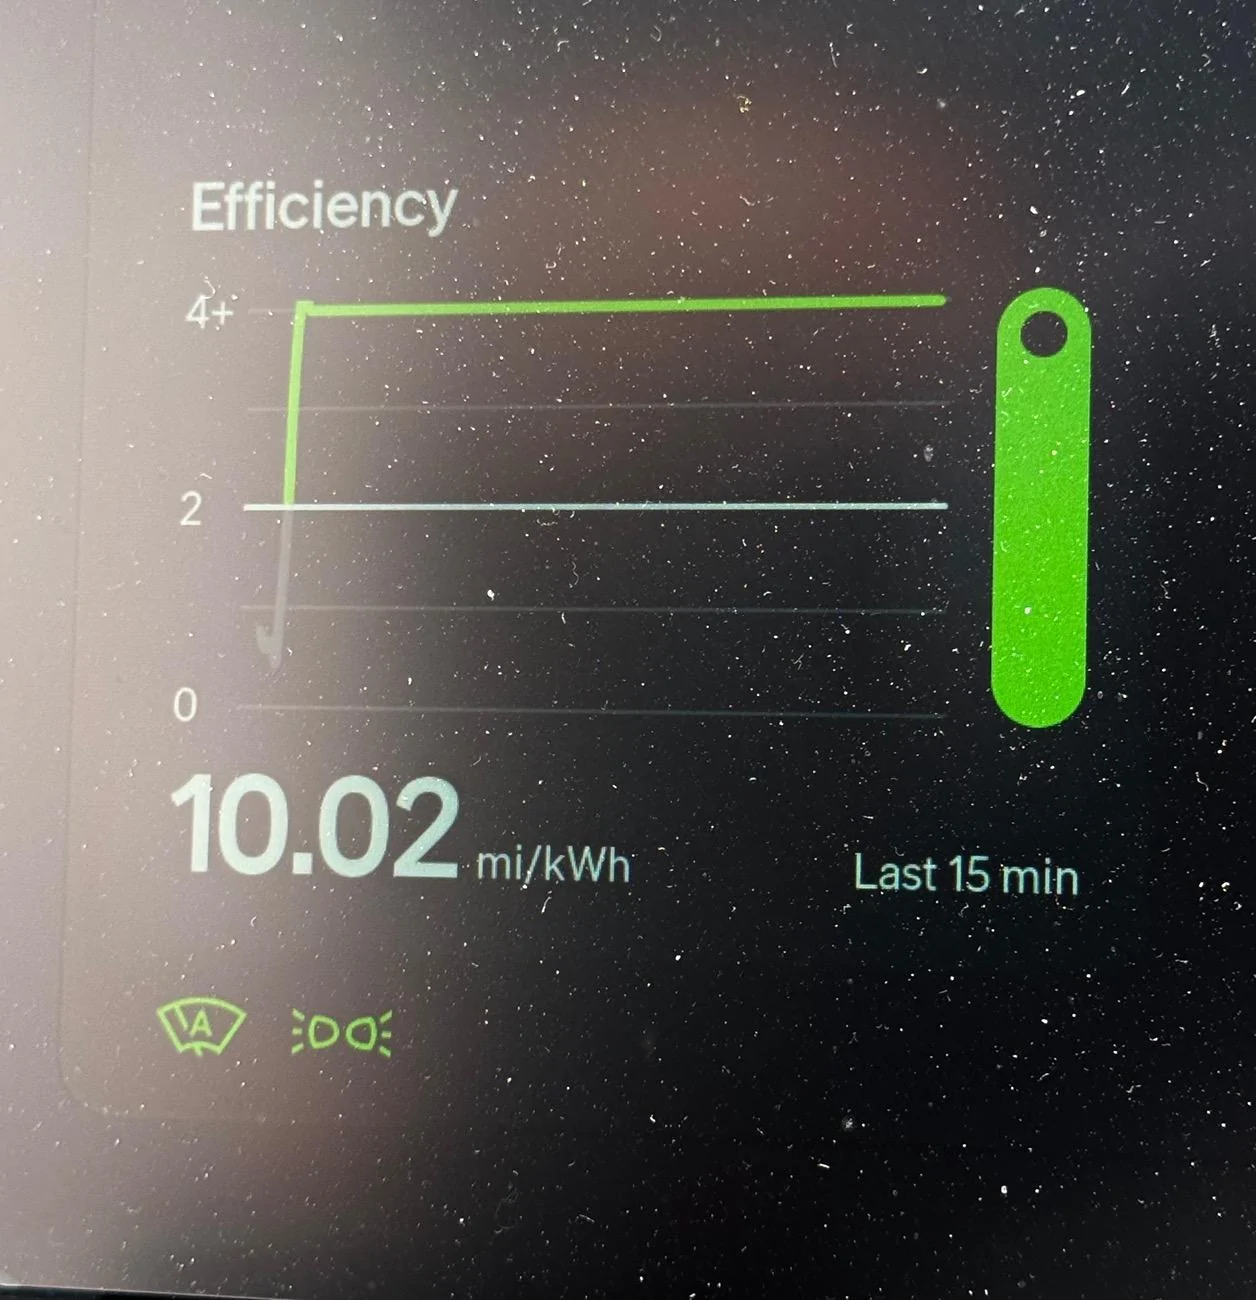
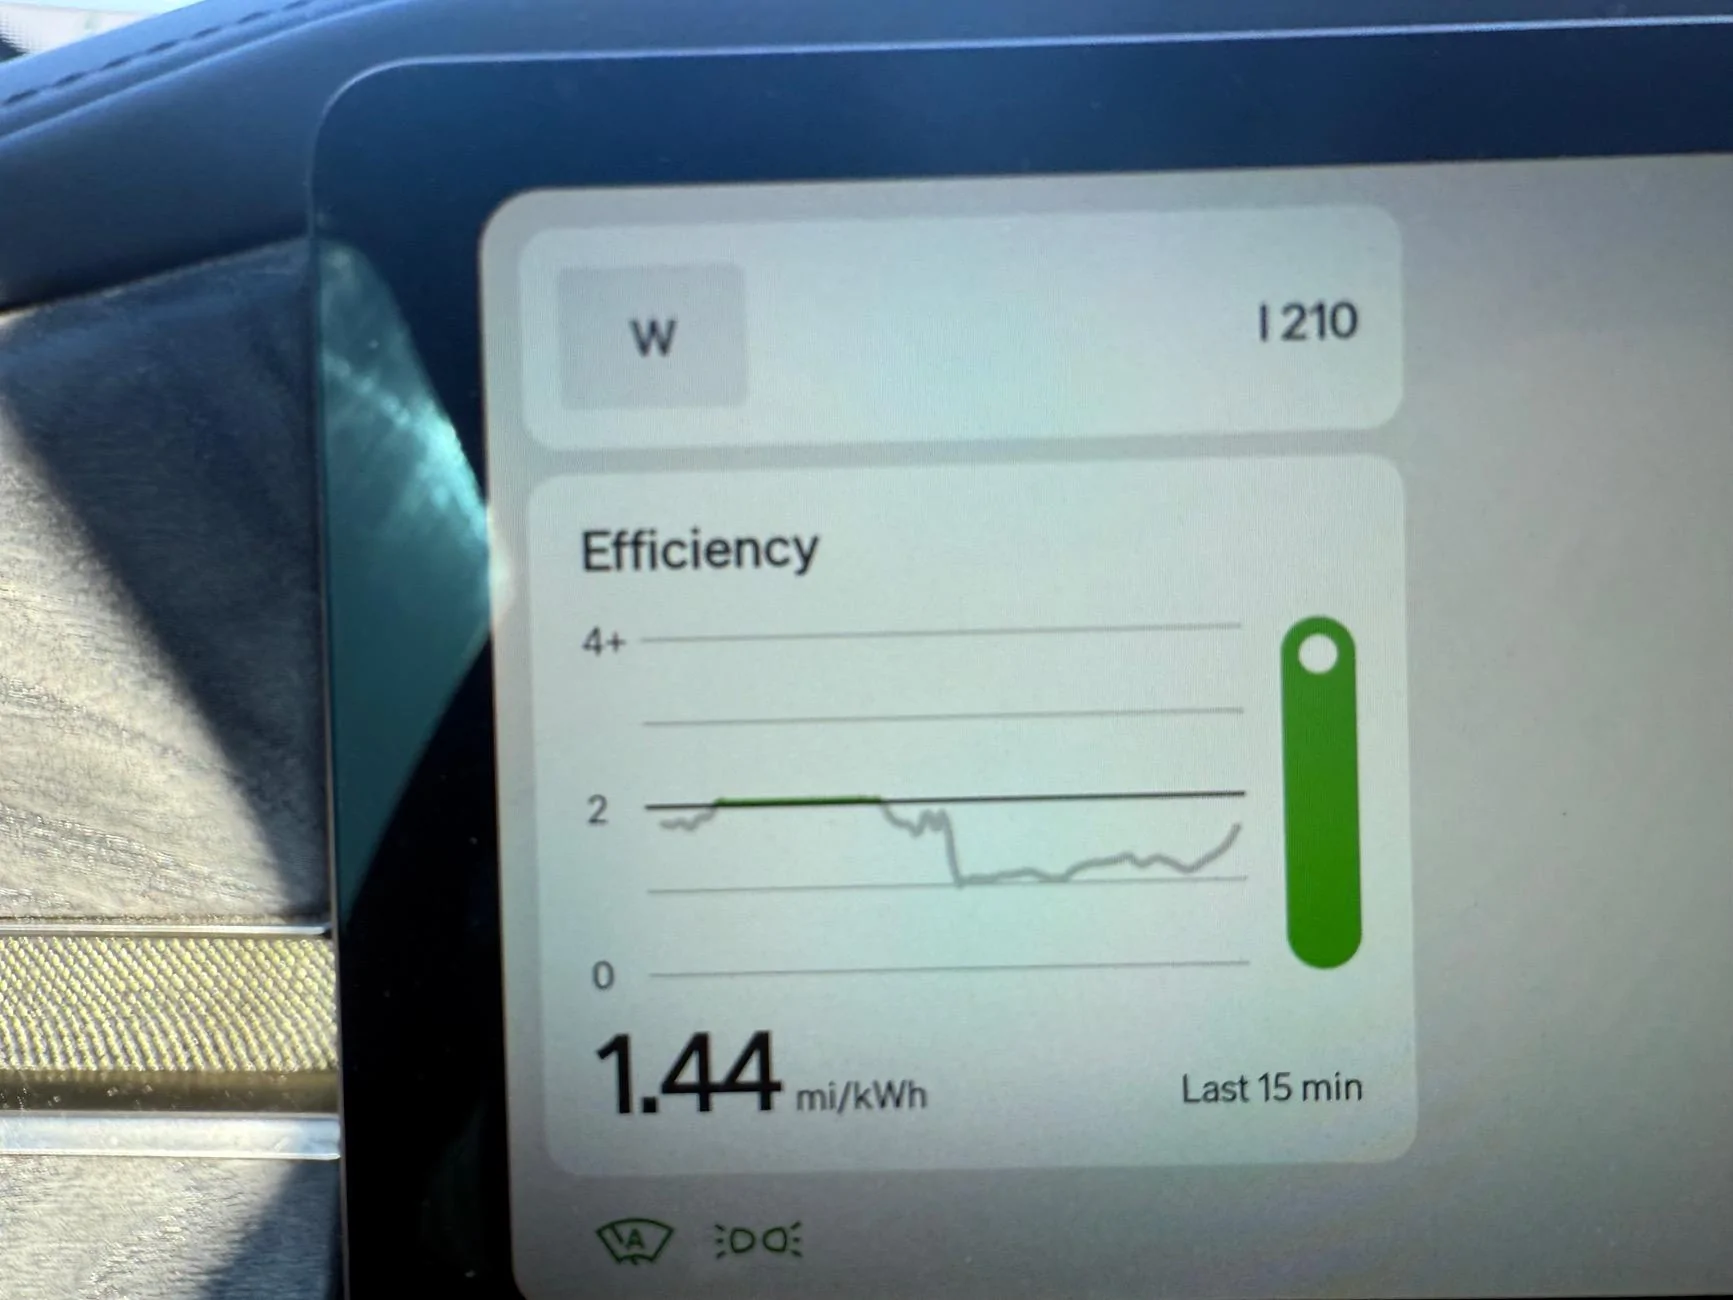
I should have noted in my first reply. The efficiency window in the driver's displayed shows a number and a line. The line does NOT go above 4.0, like @kevinhanff said. The number in that display previously showed no higher than 4, however, since installing 2025.06, my display now shows the number up to 10.02 (but, again, no change to the graph). I think 10.02 is the highest it goes as I captured this image driving east of the E/J tunnels on I70 - long downhill. The display hit 10.02 long before getting to the bottom of the hill and that's as high as it went. Picture was in my 2022 G1 R1T QM with 21s.This. The “graph” - the actual sqiggly line - won’t go above 4, no matter what the number shown bottom left displays. The original post didn’t say it did or didn’t and some of us (me included) assumed the squiggly line scaled to reflect the number at the bottom. This led to wondering if Gen 2 vehicles scaled the graph, because Gen 1 vehicles clearly do not.
Sponsored
")