Sponsored

Dissecting phantom drain estimates

Jiji

Well-Known Member
First Name
Rick
Joined
Jun 21, 2023
Threads
17
Messages
296
Reaction score
430
Location
Finger Lakes, NY
Website
github.com
Vehicles
Rivian Blue R1S
I decided to take on phantom drain with my toy iPhone app and here are some results to share with the wider Rivian community. For those that don't know, the My Rivian app logs your trips and charges and lets you view them in detail or as summaries.

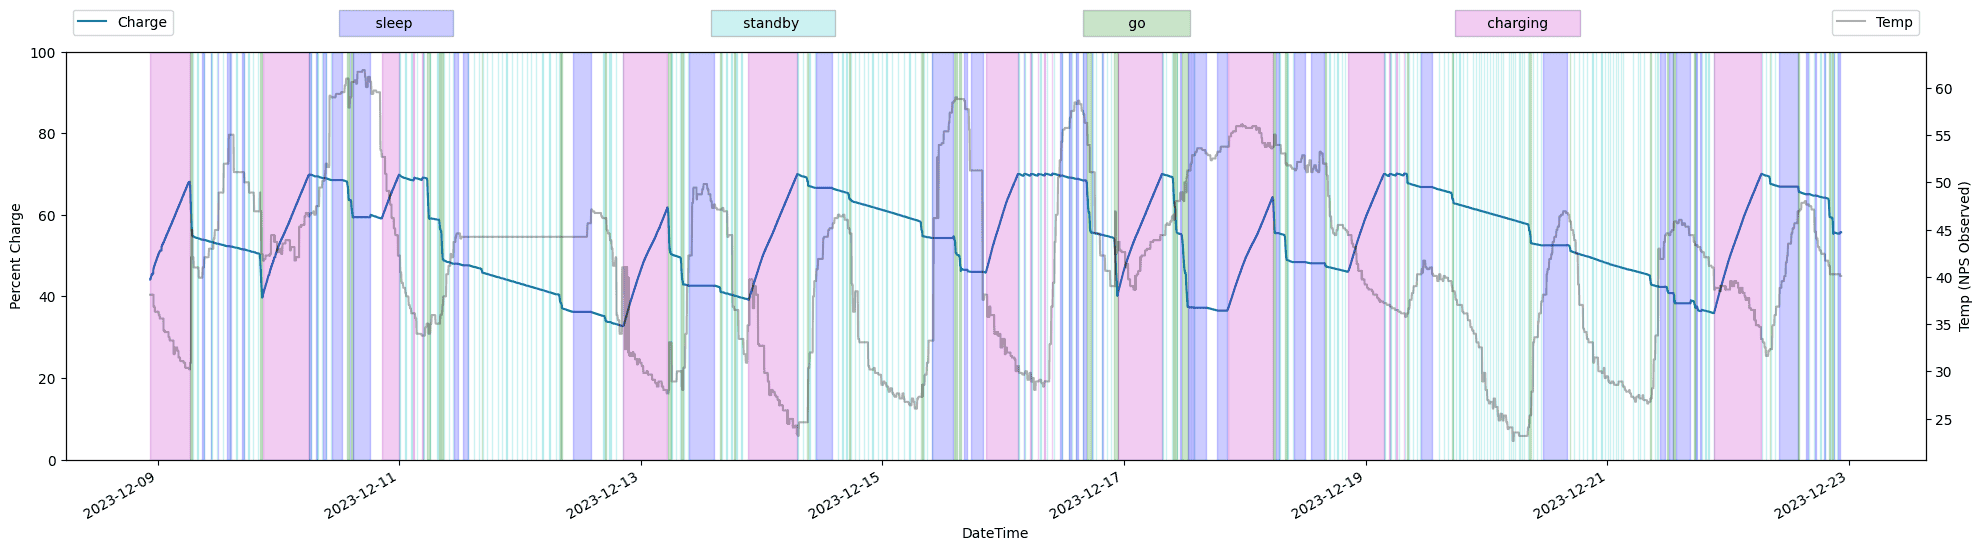
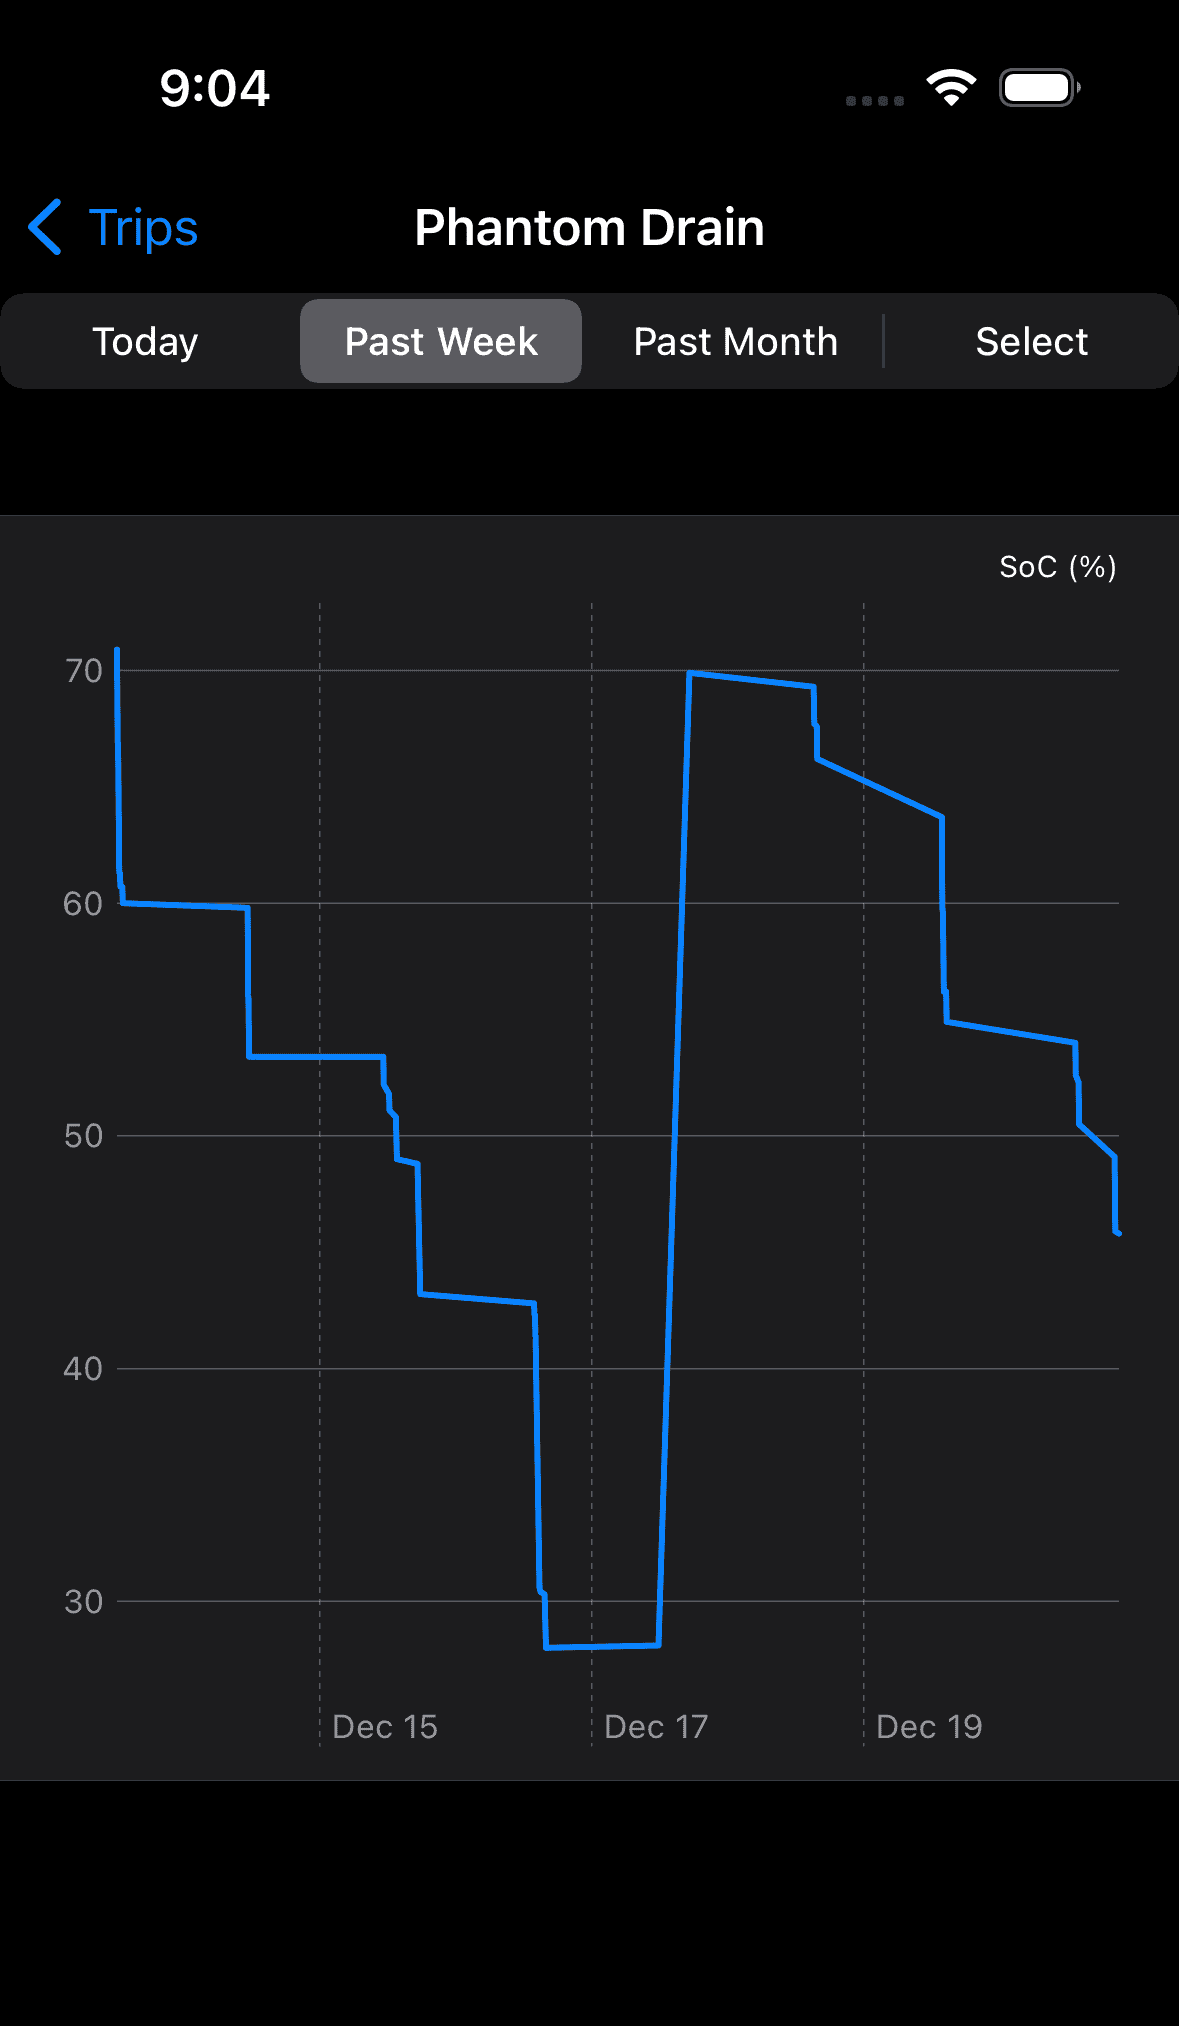
The other day there was a thread about a member's outlandish phantom drain problem. My Rivian has had a graph of phantom drain but it looked like this and was basically useless as you tried to decipher the phantom drain (horizontal lines) from the trips (vertical lines with a negative slope) and charges (vertical lines with a positive slope):

Rivian R1T R1S Dissecting phantom drain estimates 1703124314980


This is just a line chart of the charges in SoC over time and while it captures the phantom drain, it captures so much other data that the phantom drain is lost in the noise. So after cleaning the snow from my solar panels I decided to do improve on this.

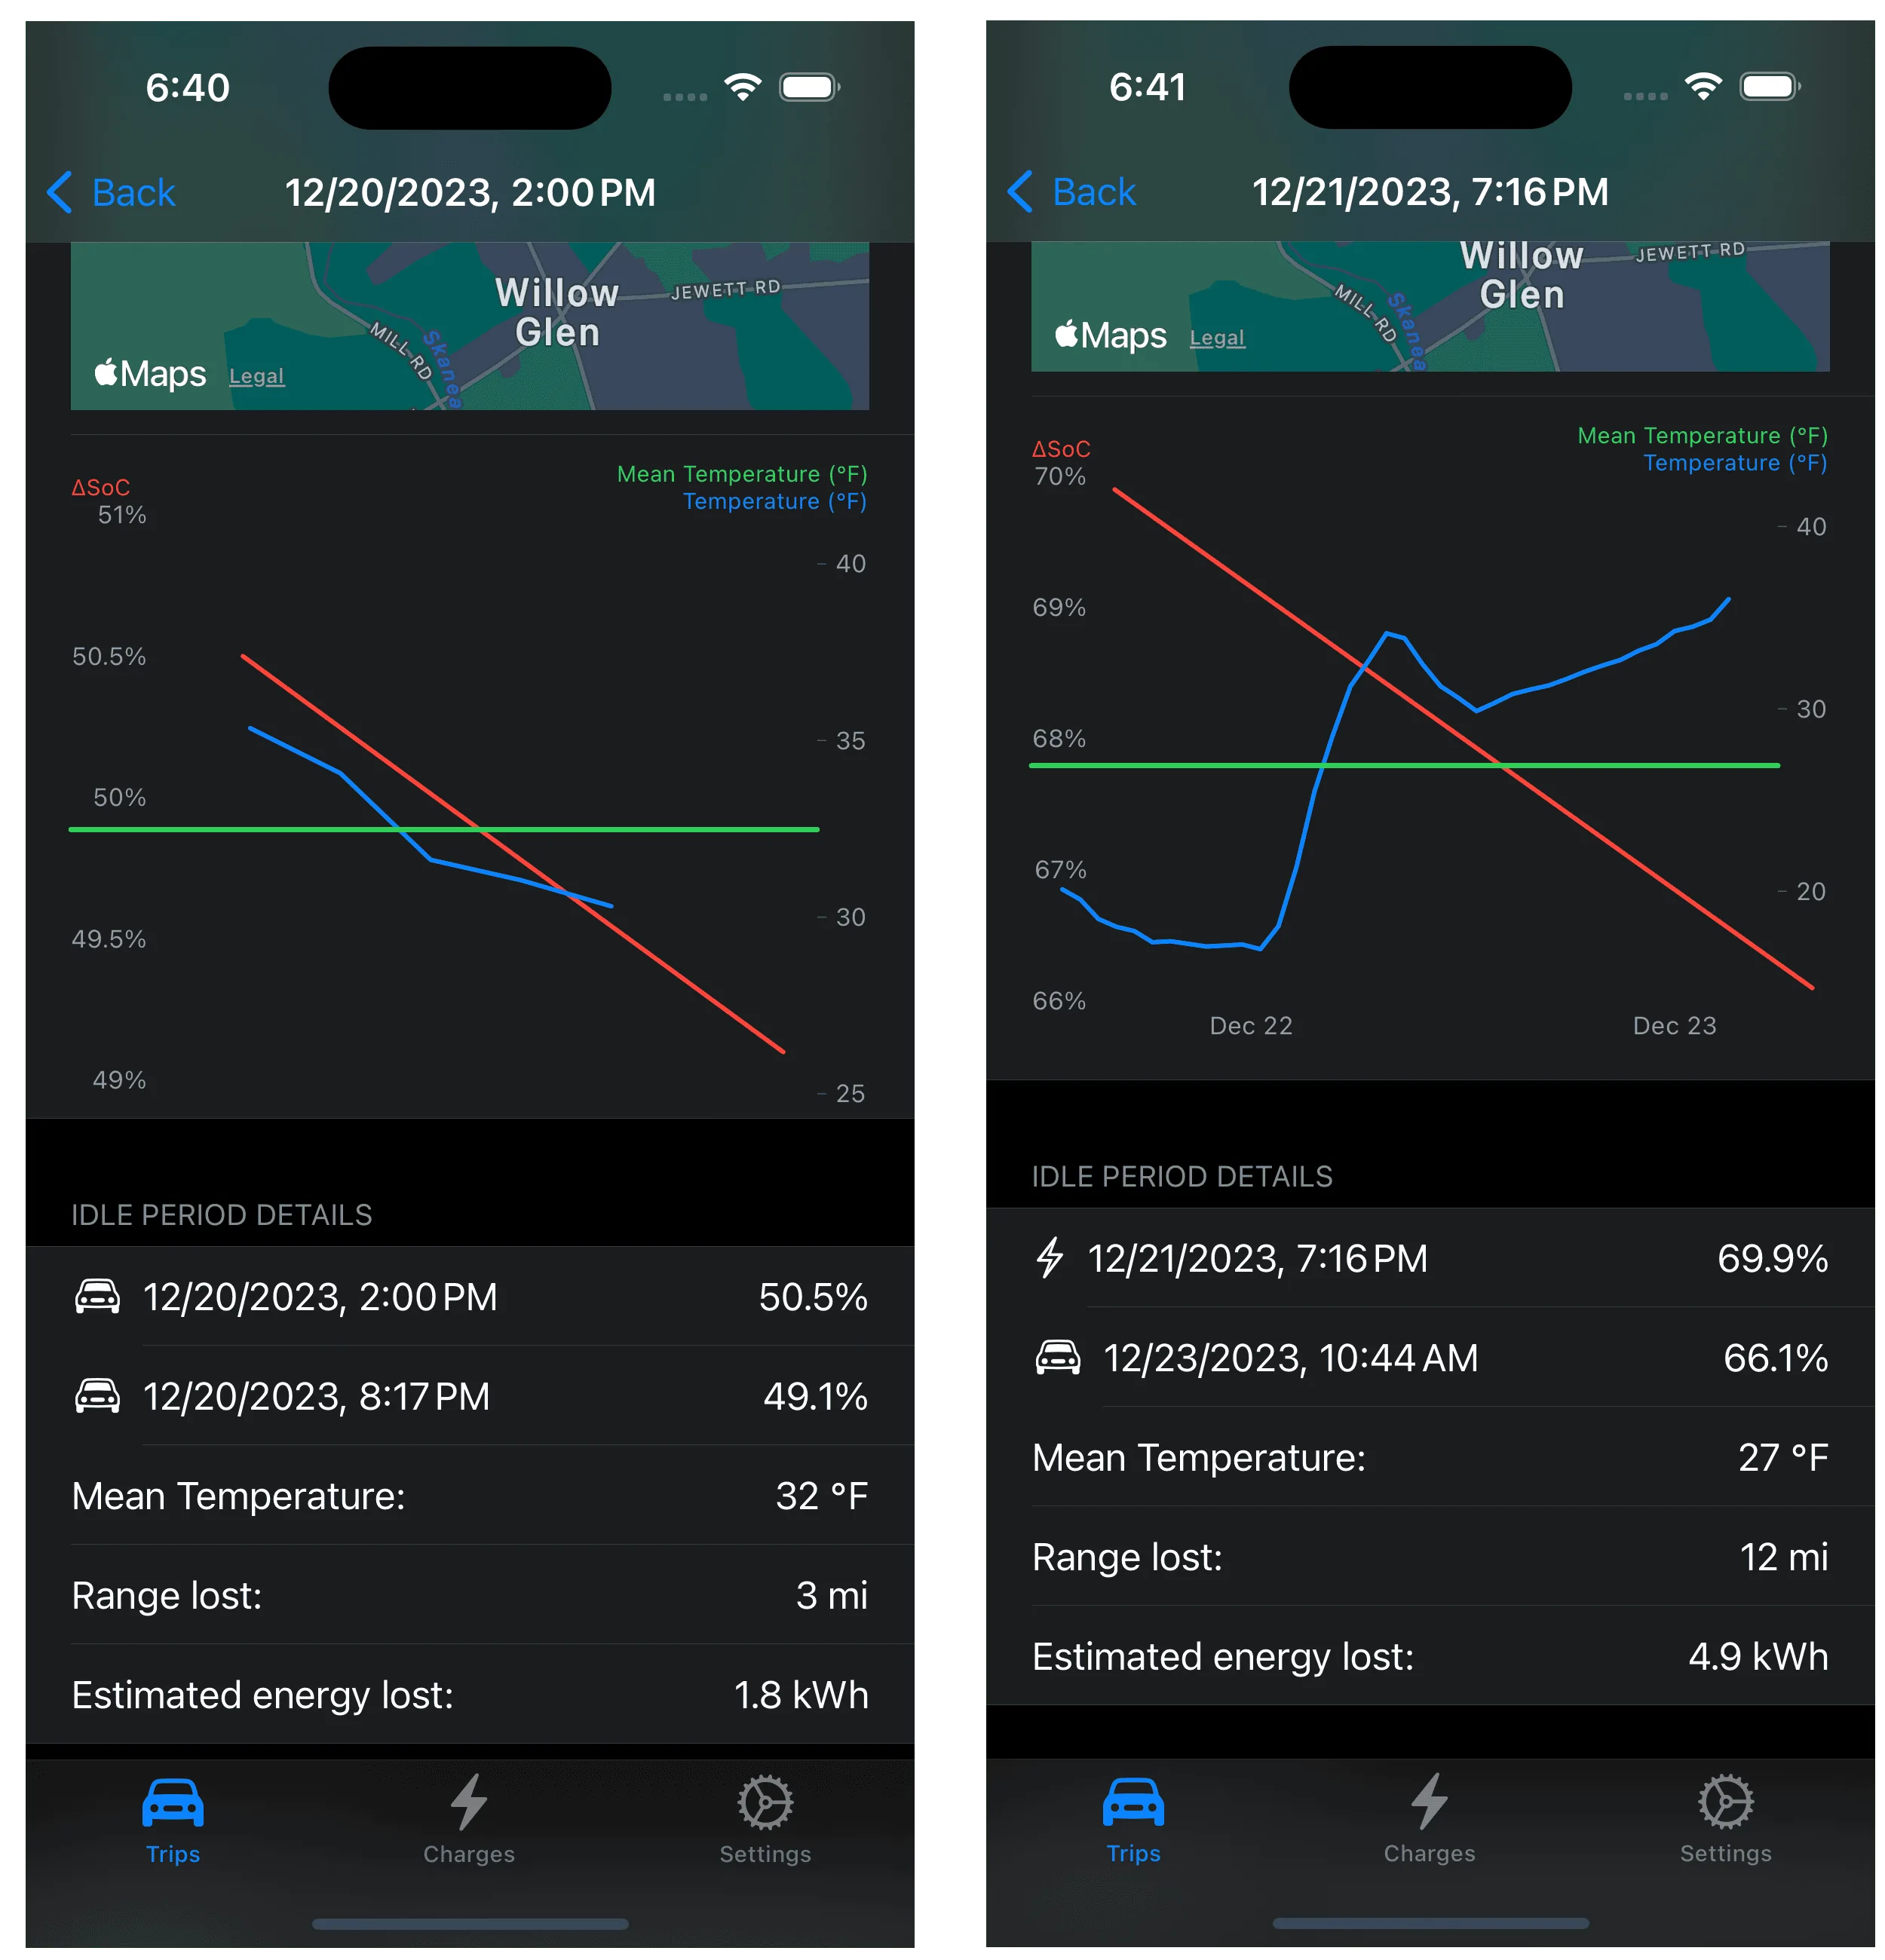
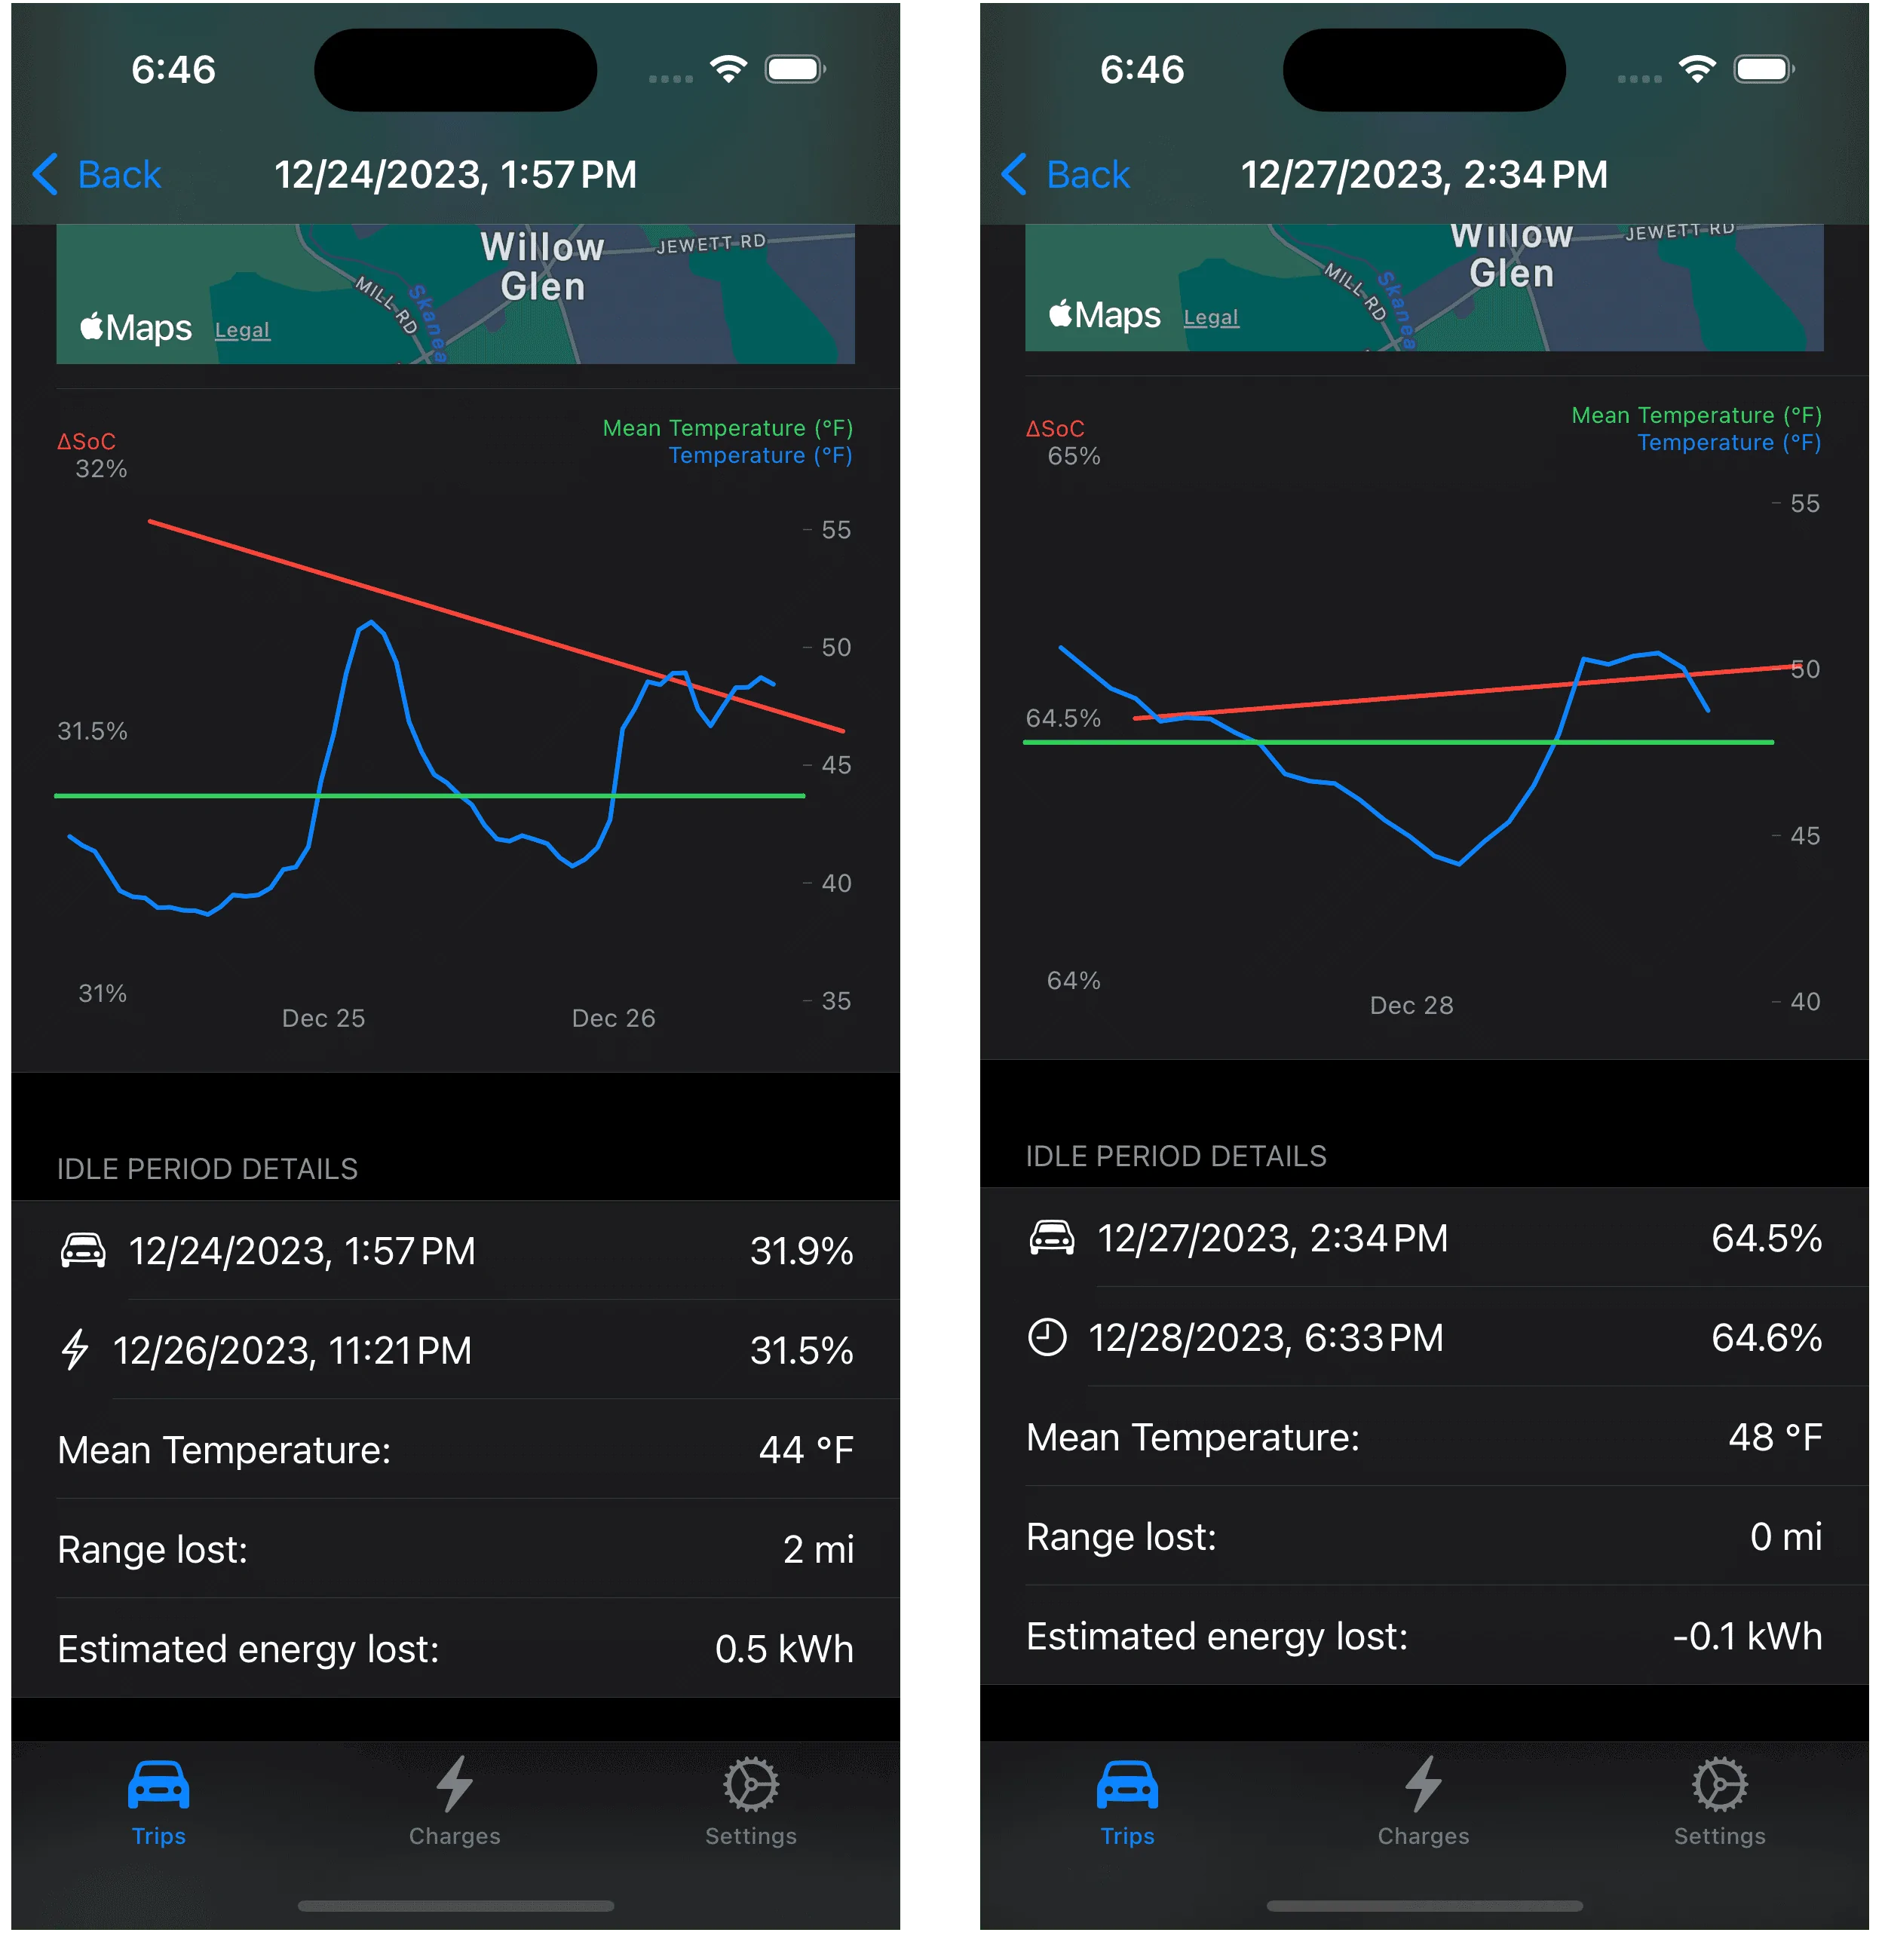
I started by picking six hours as the minimum idle time to report phantom drain. No science, just a nice value to keep the number of reported periods to a manageable number that should capture some loss. Next I needed to decide how to report the energy loss when there are no energy values to get from the Rivian as it sits idle in your garage or a parking lot. What we do have the SoC (state of charge) and I approximate an energy value by using 1.3 kWh/°SoC, a reasonable value determined over many trips or pulled from my butt, can't exactly remember which it is.

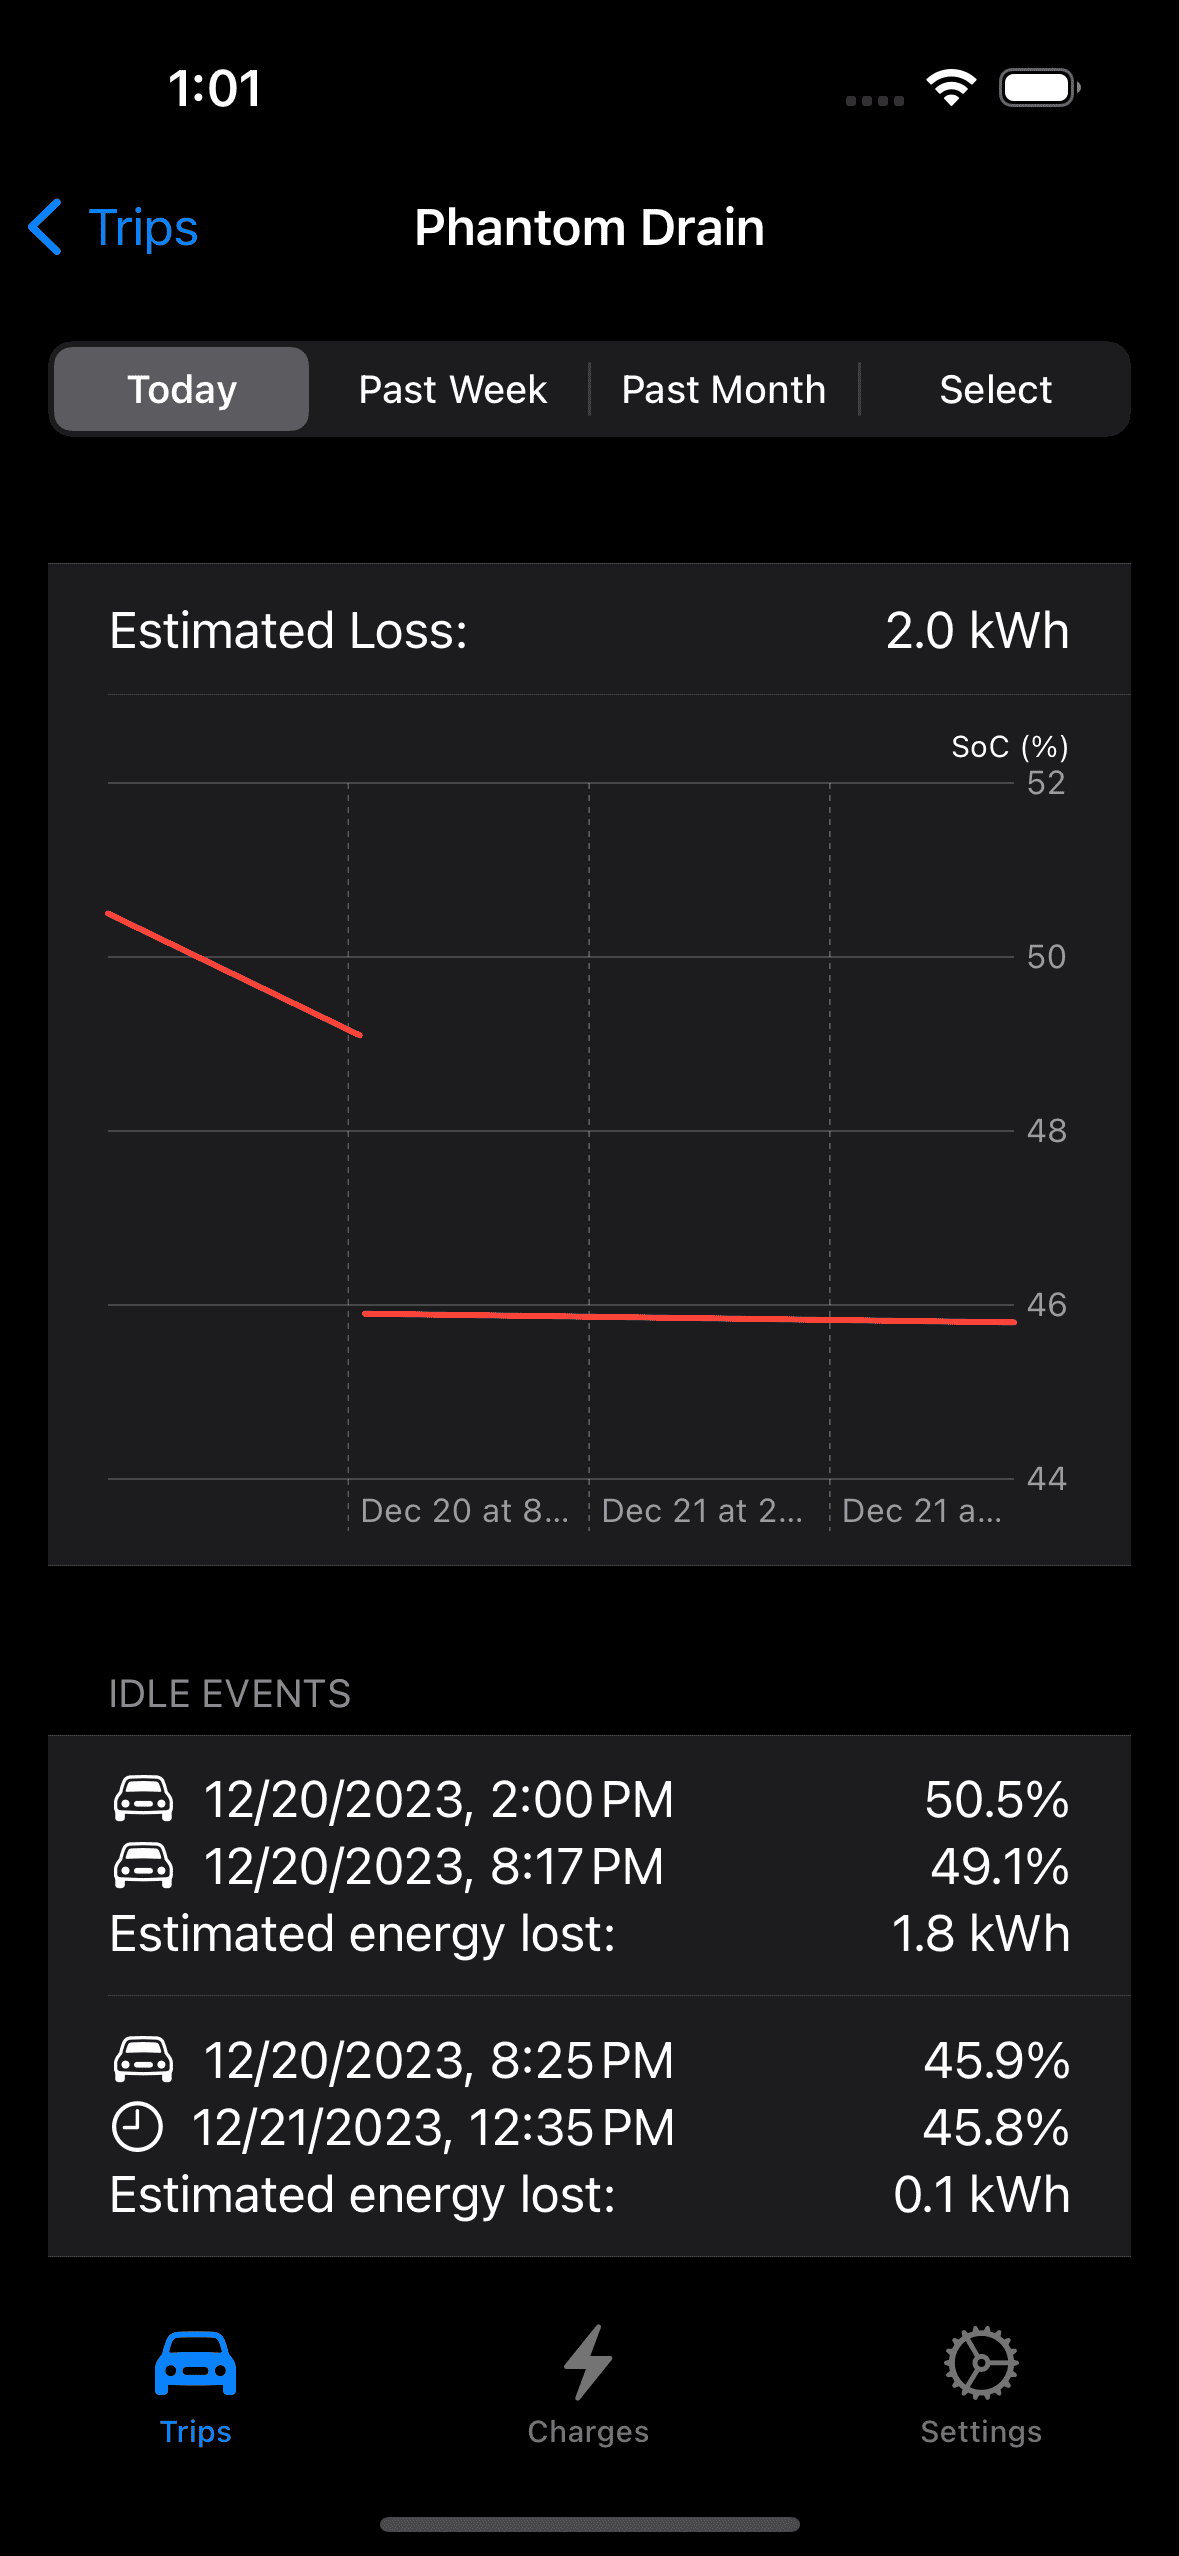
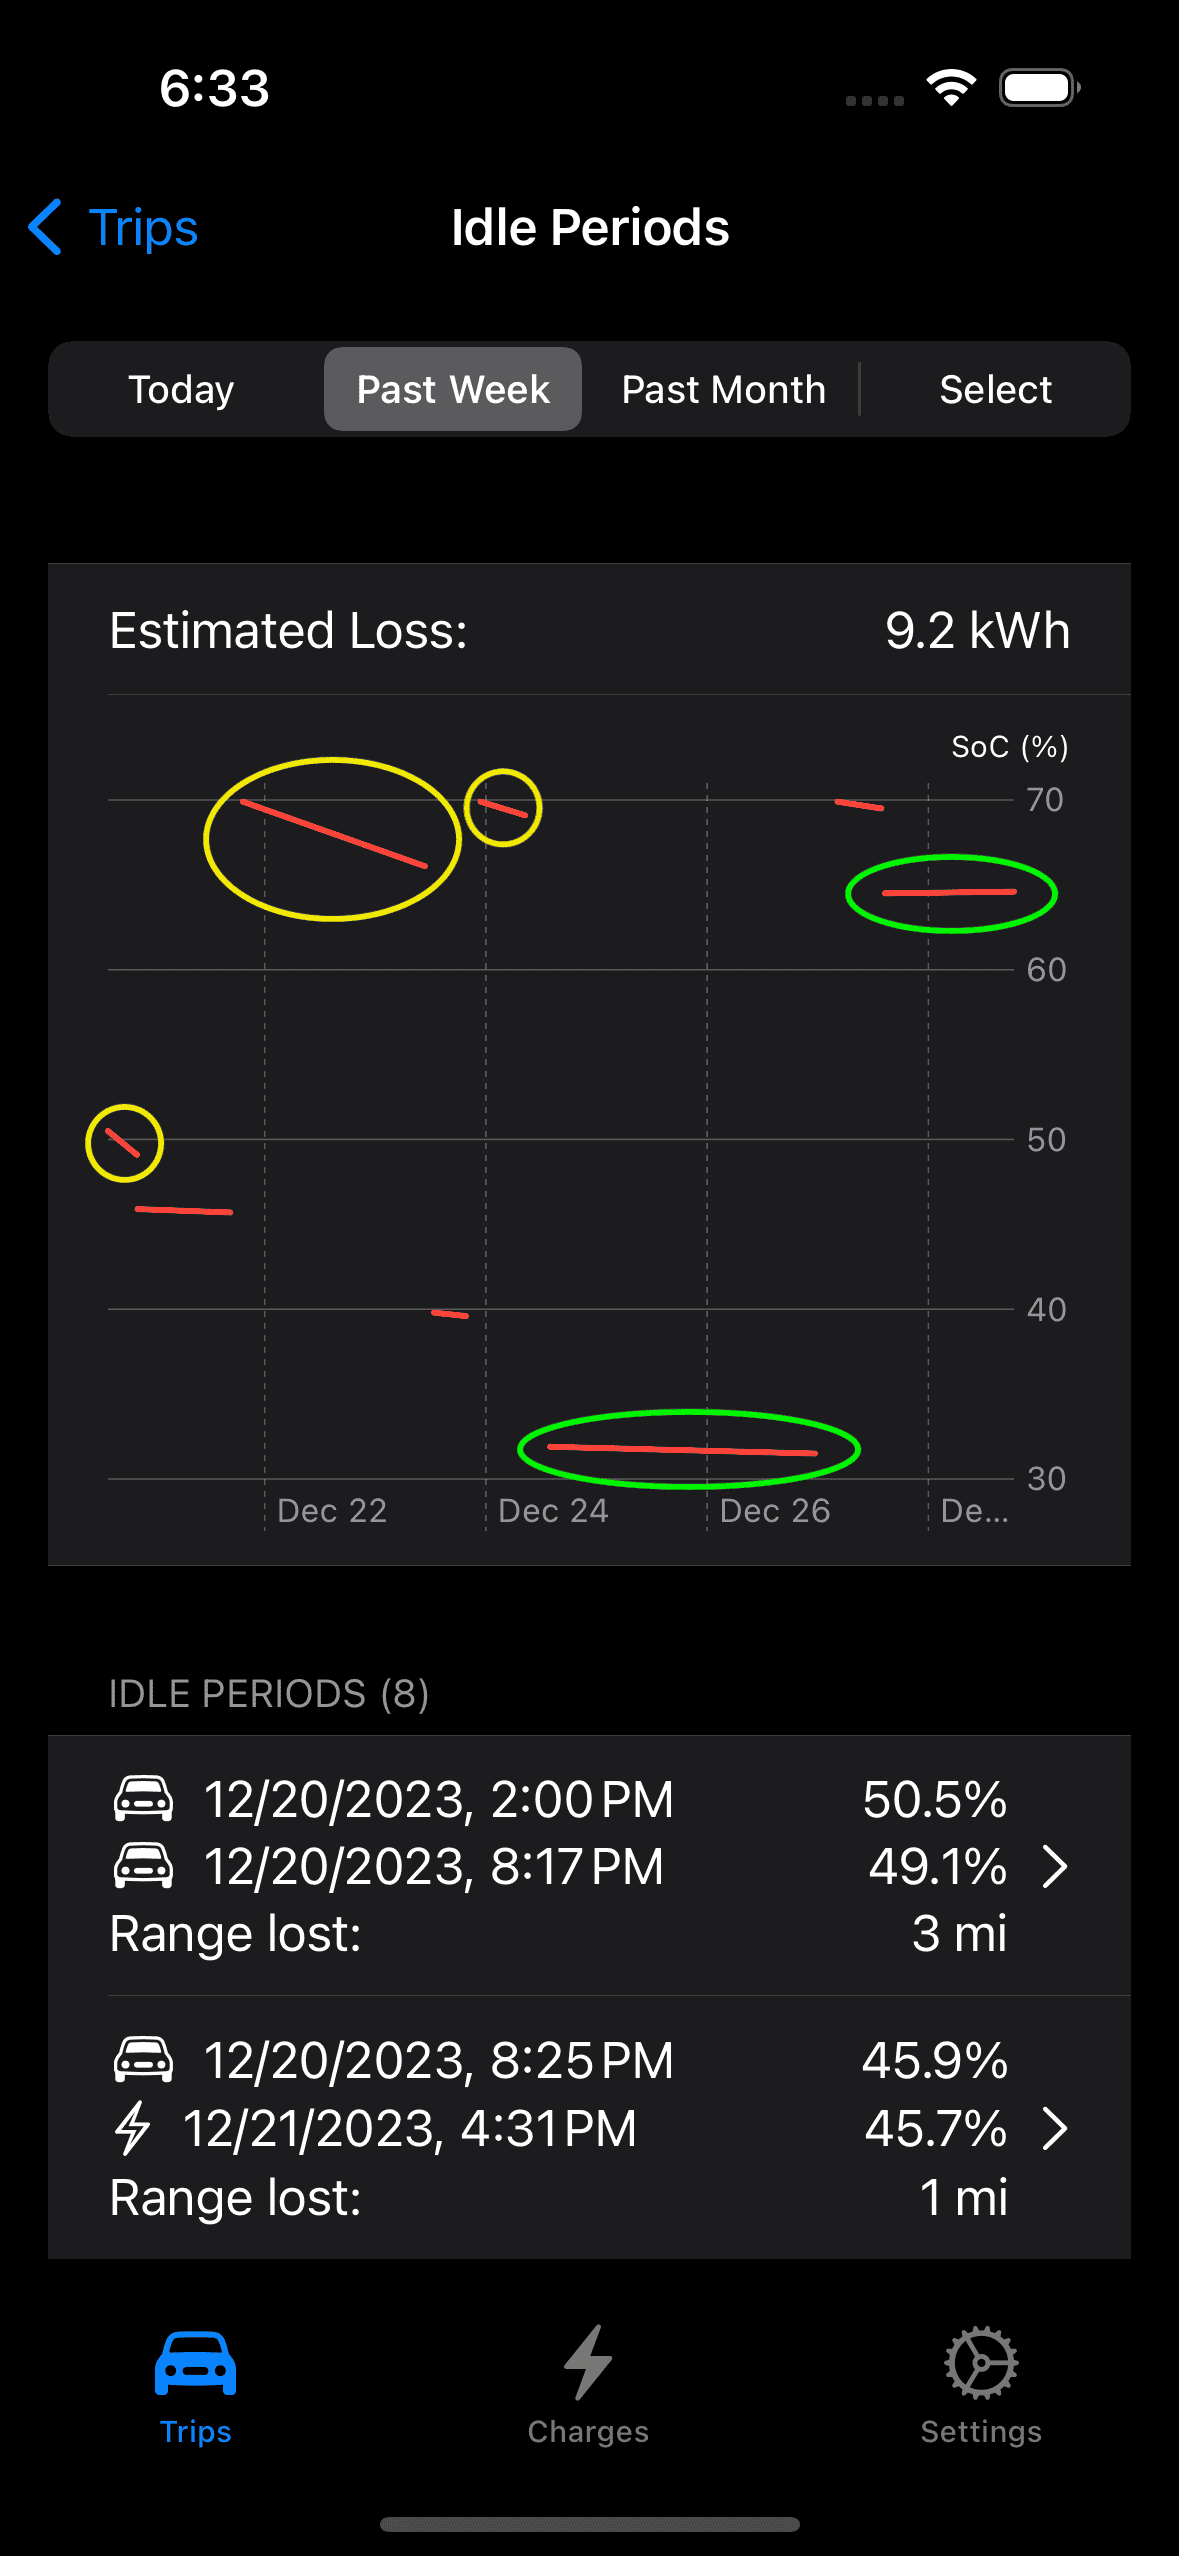
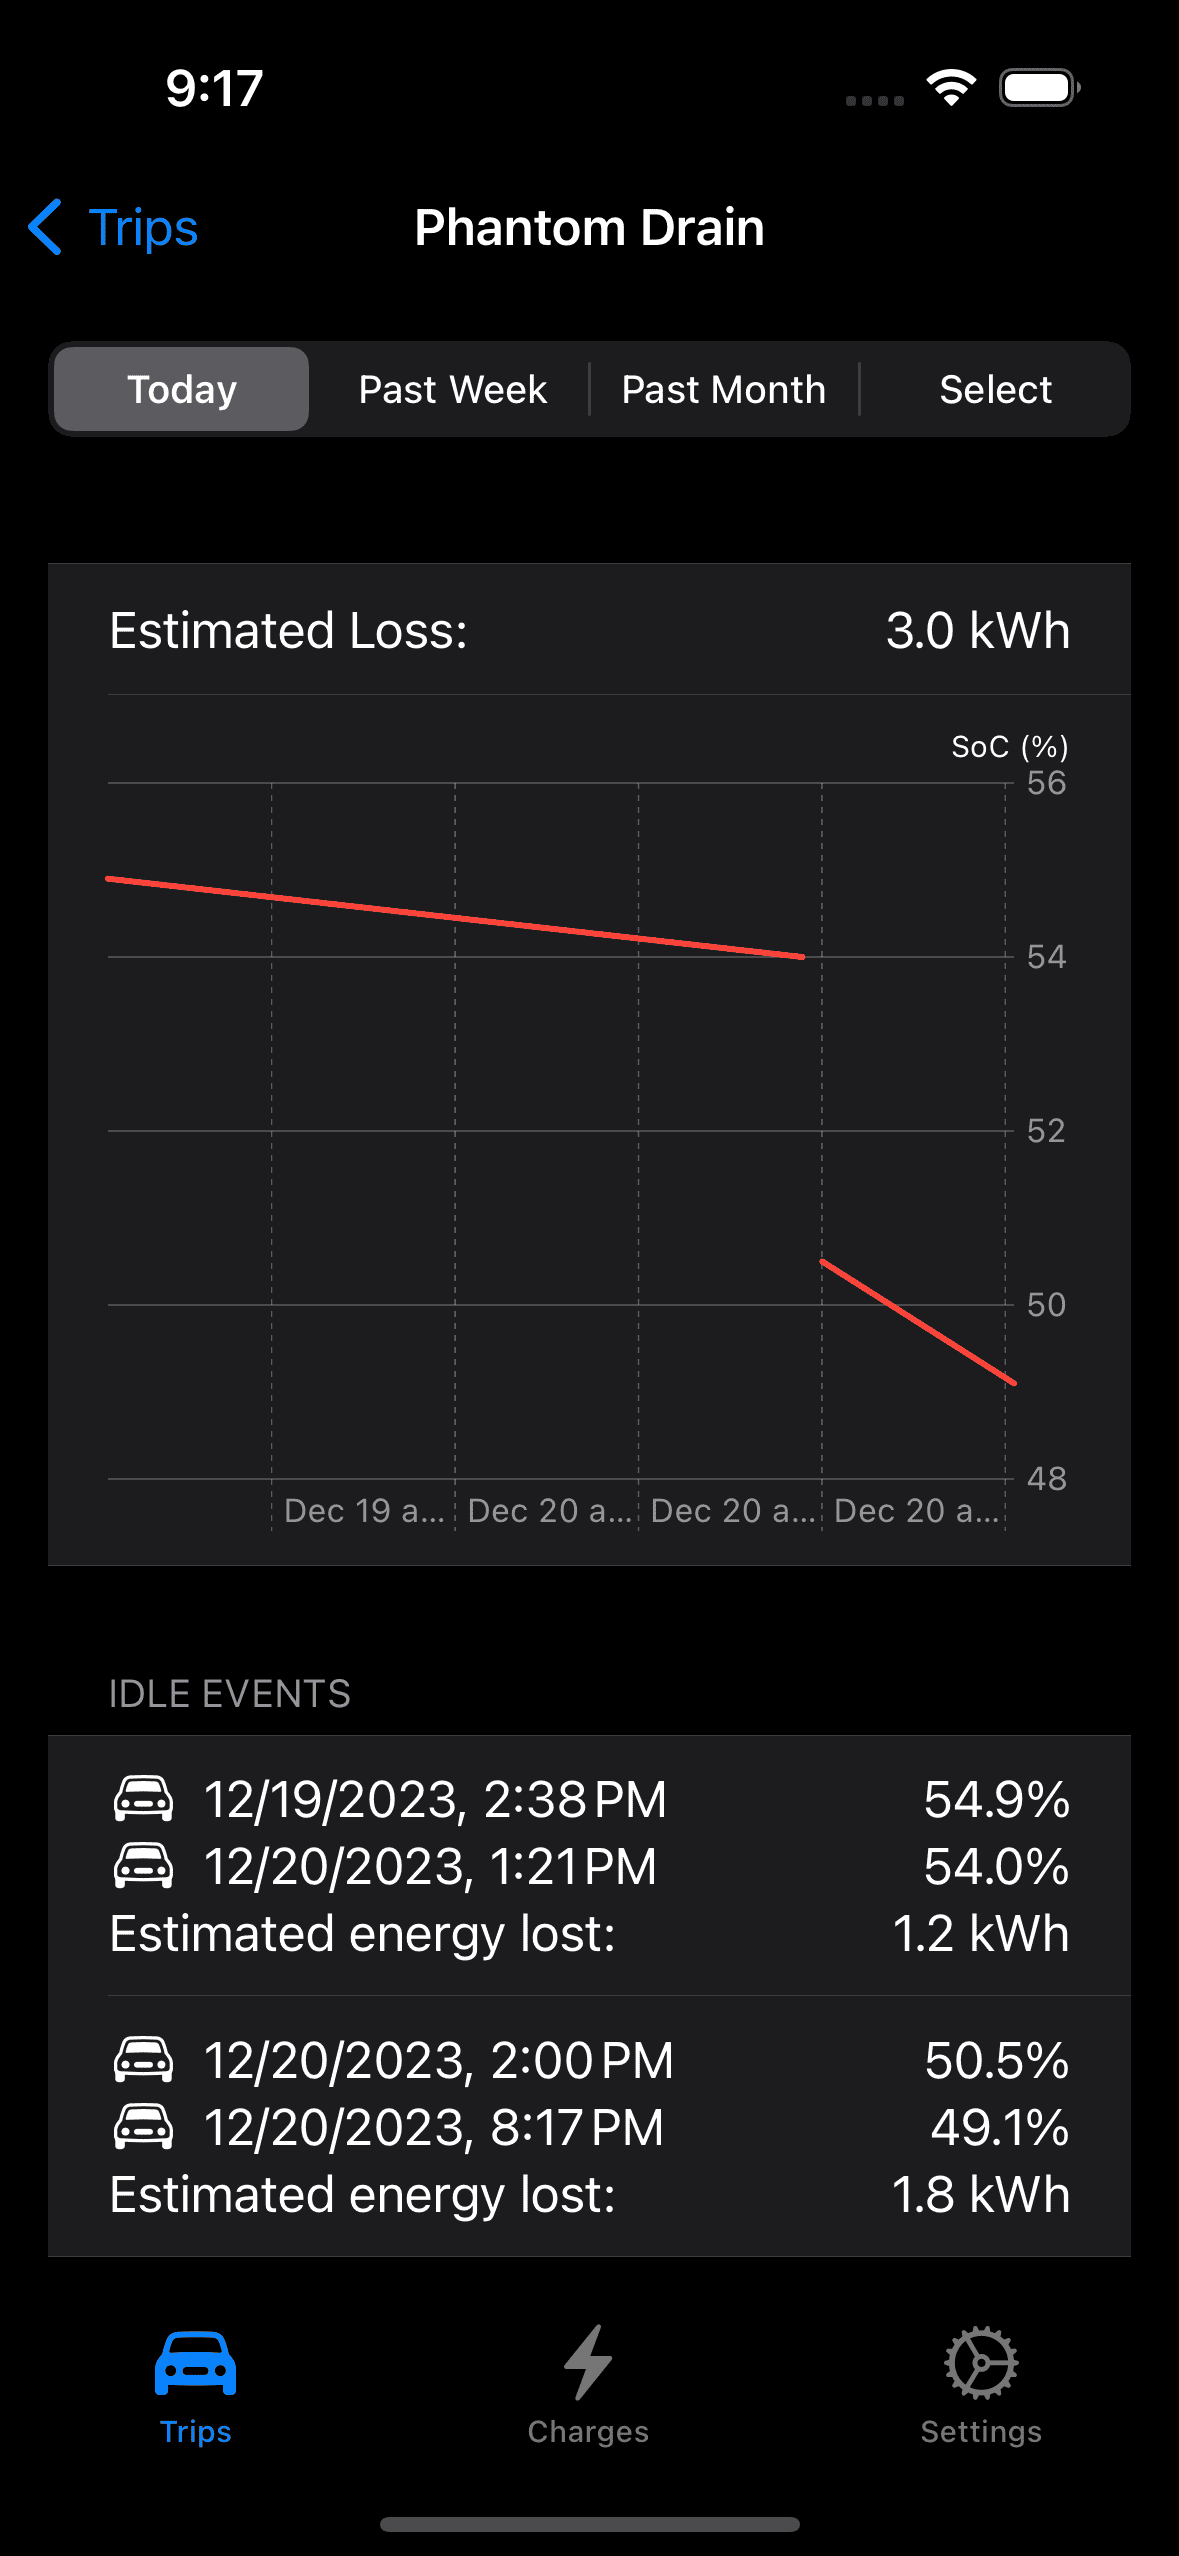
So with the I can query the data store and collect the trips and charges in the display period and discard the idle periods of less than six hours. I also read a current value of the SoC for an end point should the period include the current day I also added a display the data behind the graph so everything is in place to create a new look for the My Rivian phantom drain display. We can start with the phantom drain for today which in fact includes yesterday since a previous event is needed should you wake up and ask how did Rivvy do last night (we need a pair of events to define at least one idle period):

Rivian R1T R1S Dissecting phantom drain estimates 1703125076930


Two idle periods were reported, the first started yesterday after I parked for the day and continued until my first trip today at 1:21PM, and the second idle period which just sneaked in the six hour minimum for reporting after I parked at 2:00PM (the vertical gap between the two phantom drain lines are the two trips).

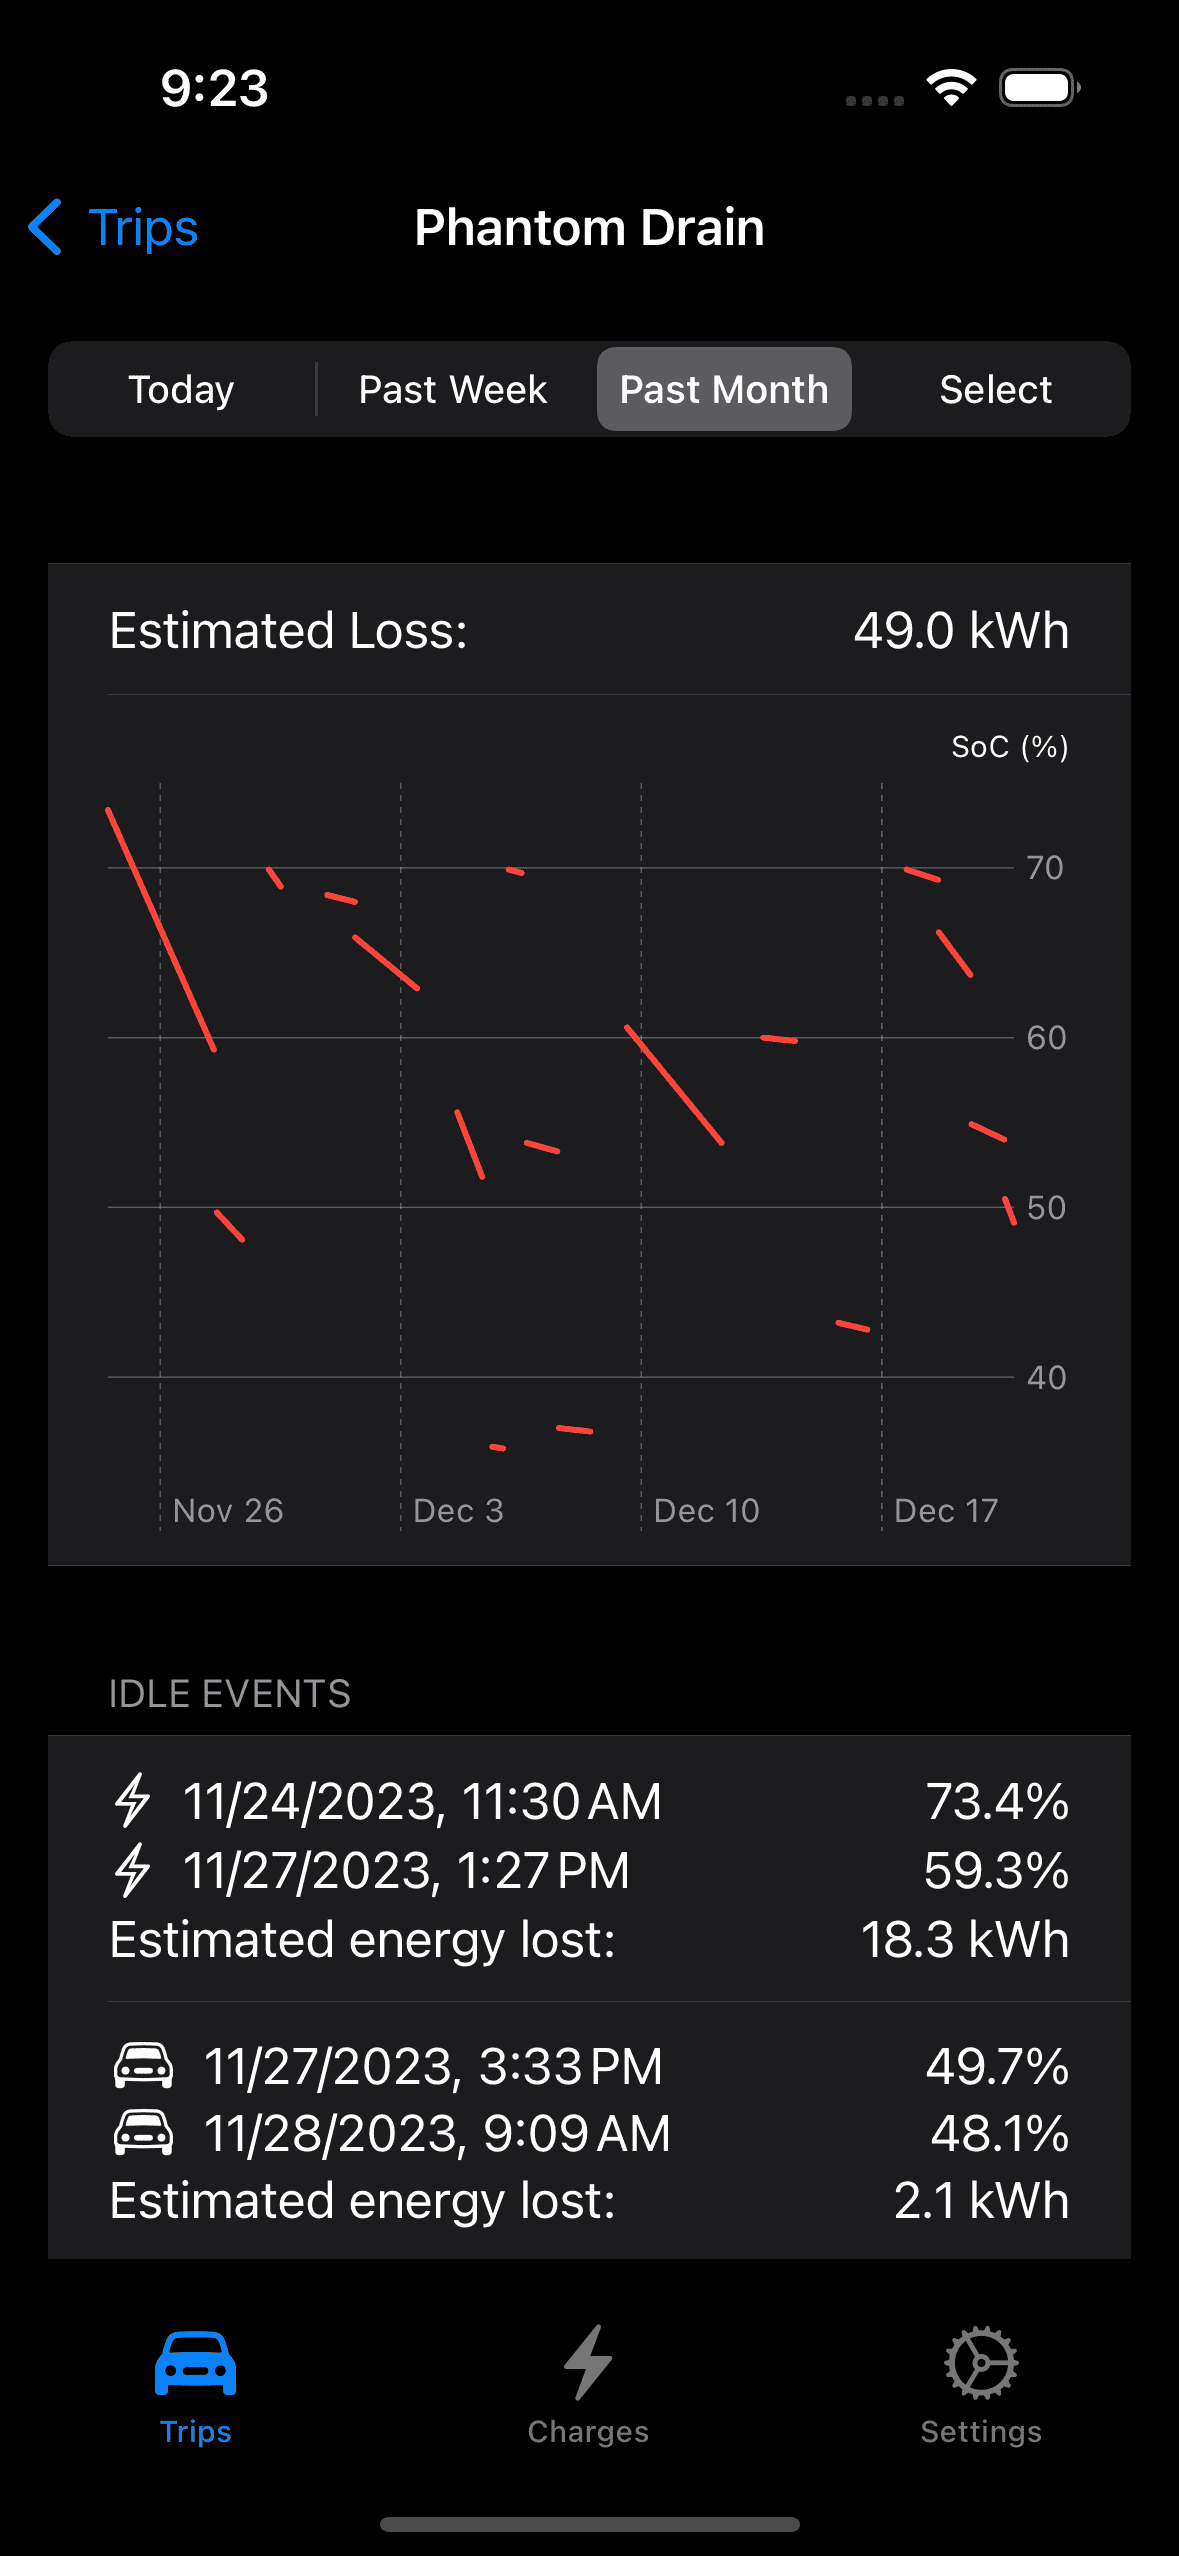
Taking a month long look at the phantom drain makes for a pretty graph, can you see where my R1S was out of commission while mobile service was waiting on a part?

Rivian R1T R1S Dissecting phantom drain estimates 1703125409538


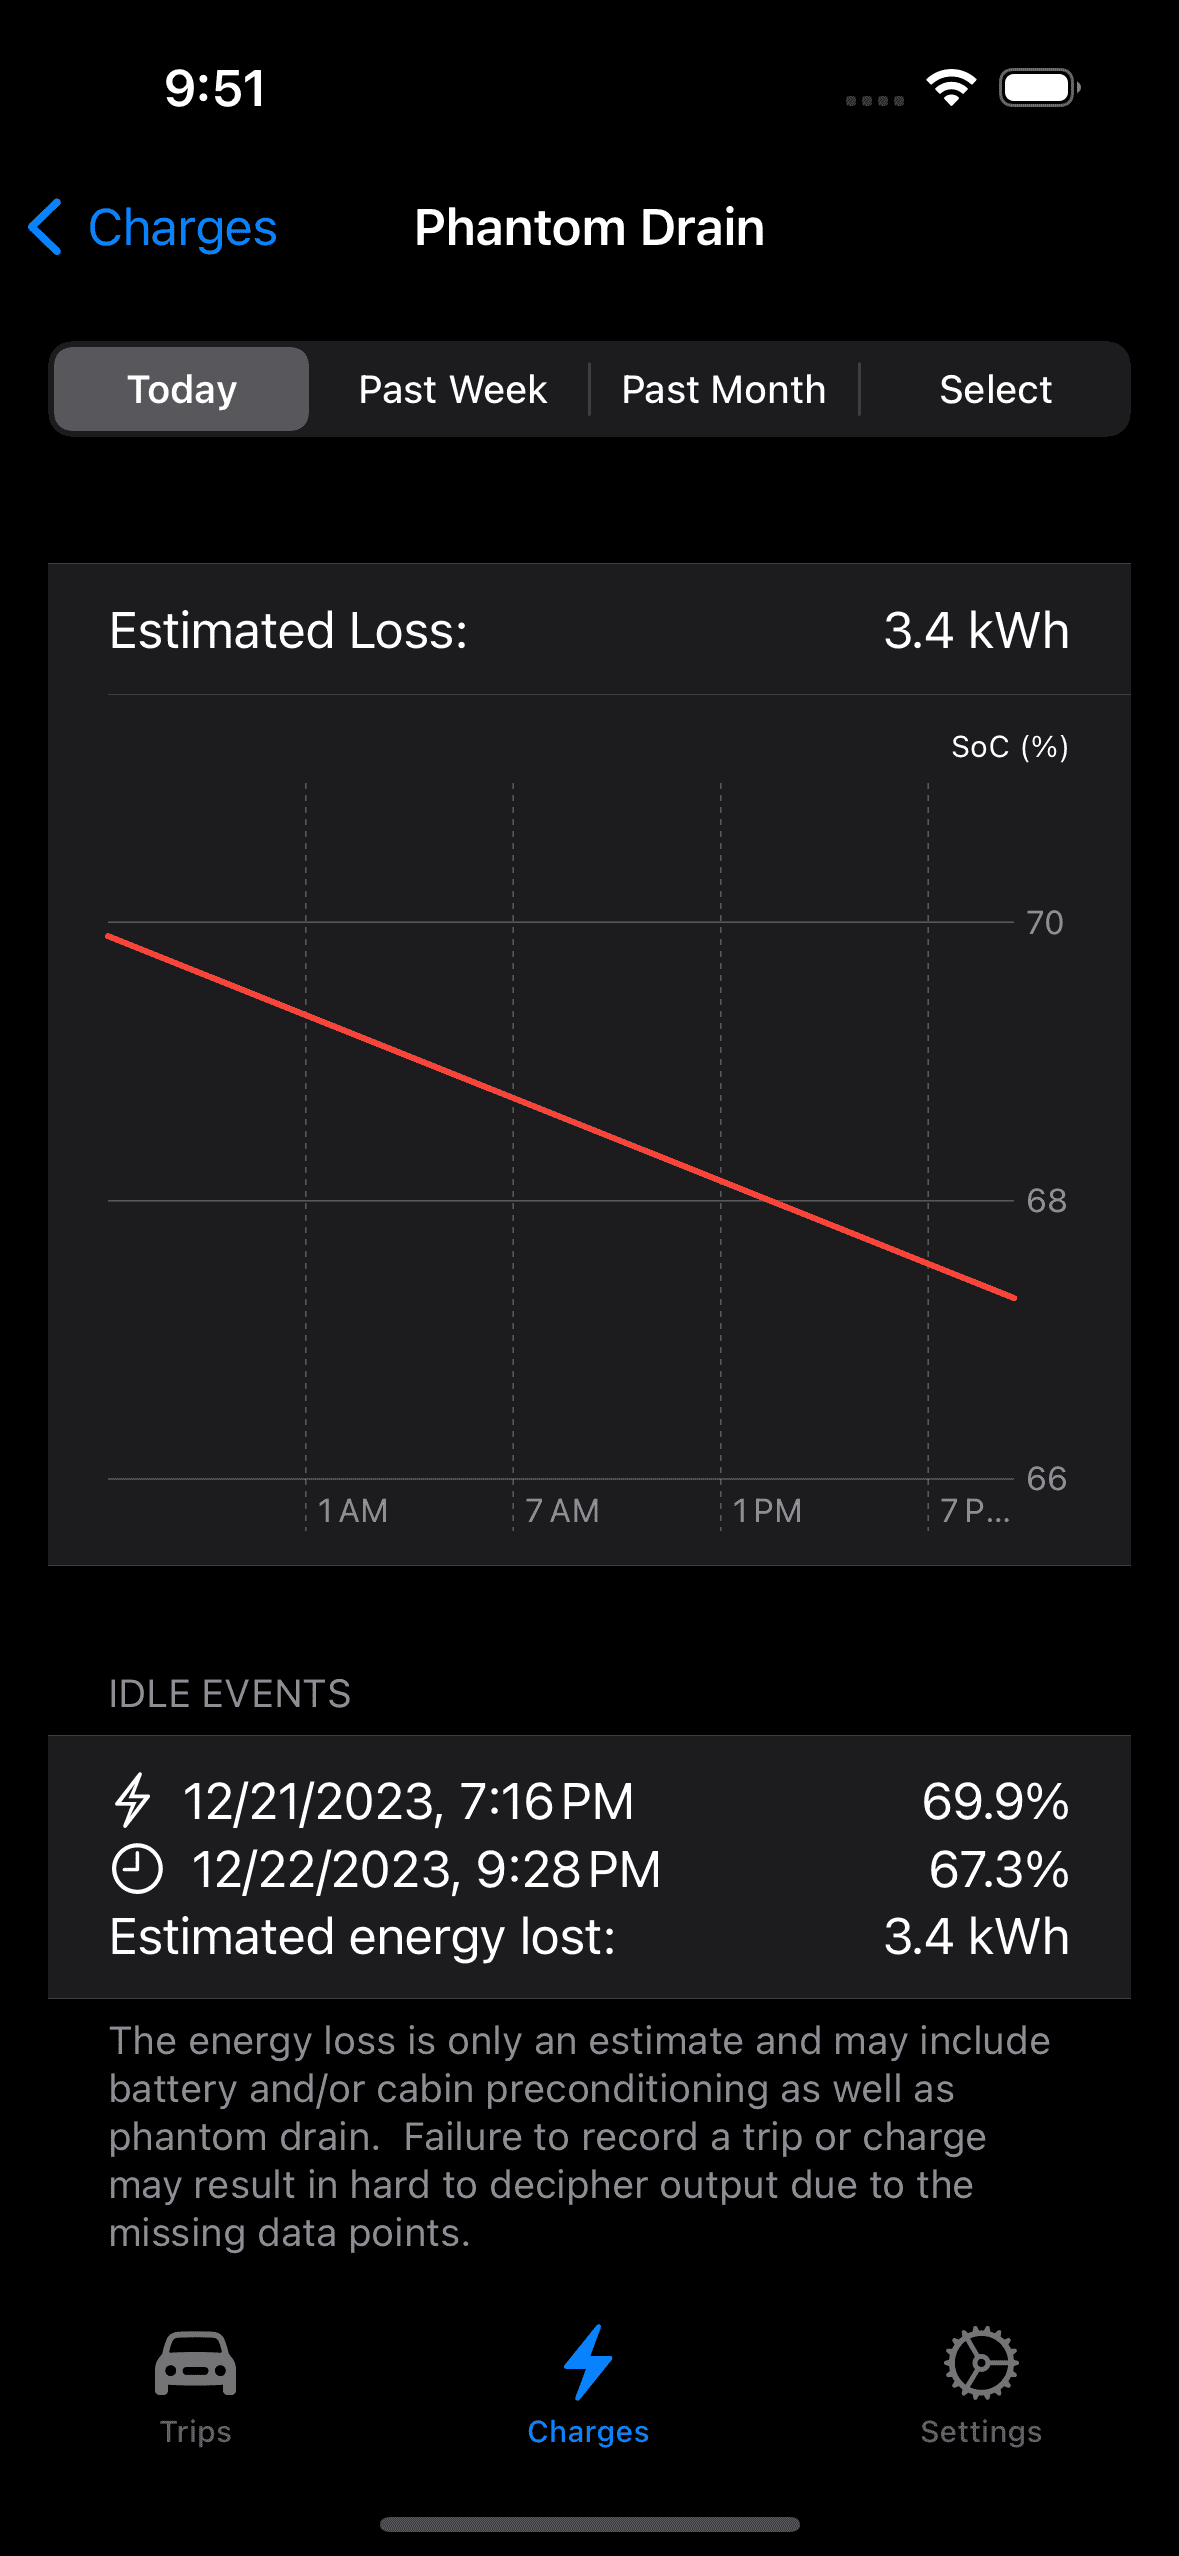
Lots more events and you can scroll the list should want to inspect any of them plus we get an estimate of the energy lost for the month. Is it correct? Maybe it is but I call it an estimate for a reason but it does make for a great conversation starter and is slightly better than looking at the Rivian app to see your SoC.
Sponsored


Janbrink

Member
First Name
Jan
Joined
Dec 10, 2020
Threads
0
Messages
10
Reaction score
10
Location
Boise, Idaho
Vehicles
Tesla Model X, Mercedes E-Class
Clubs
 
There’s much discussion about phantom drain so, like you, I did my own study. I’m not an engineer, mathematician, or anything like that so my method is pretty simple - but I believe quite accurate (over time). I own both a Tesla MX and a Rivian R1T and use the same method to determine phantom drain on both. My method is simple.

Any time I know I’m NOT going to drive the vehicle for several days, I simply make a note of the SOC and date/time (screenshot actually). Then, the next time I drive the car I do the same so I can see how much the SOC went down during a set time (while vehicle is parked in garage). I assume the MX (100D) has a 100kwh battery and R1T has 135kwh battery. Then I just do the simple math based on these numbers (I.e. used X percent in X hours to sleep). Both vehicles are set to similar settings (no proximity lock, gearguard/sentry, etc) and I keep the data in cumulative form (doing this on both cars since since May 2022).

I call it my car’s metabolism. It’s what it takes (the electrical draw) for the car to sit there in the garage appearing to do nothing. My 2018 MX has a metabolism of 21 watts. My 2022 R1T has a metabolism of 156 watts. I’m not sure why this is. I probably should revisit the numbers and recalculate them to include idle time only during the last 3 months or so (as opposed to 18 months) to try to determine if Rivian is making any progress on this. I keep hearing they are, so I should try to verify. BTW I love both these vehicles and never looked back after my first EV!
 
Last edited:

RivRyan

Well-Known Member
First Name
Ryan
Joined
Oct 15, 2023
Threads
8
Messages
217
Reaction score
171
Location
Evanston, IL
Vehicles
Toyota Tundra, ID4
Occupation
consulting
> Lots more events and you can scroll the list

Are you saying we can scroll the list? I don't see a link.

Anyway, it's intriguing work you're doing, even just seeing the images posted. Thanks.
 
OP
OP
Jiji

Jiji

Well-Known Member
First Name
Rick
Joined
Jun 21, 2023
Threads
17
Messages
296
Reaction score
430
Location
Finger Lakes, NY
Website
github.com
Vehicles
Rivian Blue R1S
> Lots more events and you can scroll the list

Are you saying we can scroll the list? I don't see a link.

Anyway, it's intriguing work you're doing, even just seeing the images posted. Thanks.
You can scroll in the app, not in the posted screenshots. I suppose I could stitch multiple screenshots together but just makes for a longer post.
 
OP
OP
Jiji

Jiji

Well-Known Member
First Name
Rick
Joined
Jun 21, 2023
Threads
17
Messages
296
Reaction score
430
Location
Finger Lakes, NY
Website
github.com
Vehicles
Rivian Blue R1S
There’s much discussion about phantom drain so, like you, I did my own study. I’m not an engineer, mathematician, or anything like that so my method is pretty simple - but I believe quite accurate (over time). I own both a Tesla MX and a Rivian R1T and use the same method to determine phantom drain on both. My method is simple.

Any time I know I’m NOT going to drive the vehicle for several days, I simply make a note of the SOC and date/time (screenshot actually). Then, the next time I drive the car I do the same so I can see how much the SOC went down during a set time (while vehicle is parked in garage). I assume the MX (100D) has a 100kwh battery and R1T has 135kwh battery. Then I just do the simple math based on these numbers (I.e. used X percent in X hours to sleep). Both vehicles are set to similar settings (no proximity lock, gearguard/sentry, etc) and I keep the data in cumulative form (doing this on both cars since since May 2022).

I call it my car’s metabolism. It’s what it takes (the electrical draw) for the car to sit there in the garage appearing to do nothing. My 2018 MX has a metabolism of 21 watts. My 2022 R1T has a metabolism of 156 watts. I’m not sure why this is. I probably should revisit the numbers and recalculate them to include idle time only during the last 3 months or so (as opposed to 18 months) to try to determine if Rivian is making any progress on this. I keep hearing they are, so I should try to verify. BTW I love both these vehicles and never looked back after my first EV!
You nailed it. I have just automated your solution, measure the SoC at the start and end of an idle period and multiply by the estimated kWh/%SoC to get units in kWh. I can be a little more accurate since I read the SoC to a tenth of a percent but it also isn't a monotonic function as sometimes it goes up after sitting. Or you get results like this where the 'metabolism' isn't constant:

Rivian R1T R1S Dissecting phantom drain estimates 1703181759203


I think this is a case of the battery management software rebalancing cells (so something like that) so it presents as a lower rate of loss.

I had a 2019 M3 and back then the Tesla forums were filled with posts of phantom drain and over time Tesla has improved it, 21W is impressive in my opinion. My other EV is now a Mustang Mach-E which is easy to get data from (working OBDII) and the SoC doesn't budge but I don't think it is as 'connected' as the Rivian and Tesla are.

Rivian can certainly continue to improve this, your estimate of 150W works out to about 3.5kWh per day and is probably inline with other Rivian owners are seeing but an outlier among current EVs.
 
Last edited:

Sponsored

Janbrink

Member
First Name
Jan
Joined
Dec 10, 2020
Threads
0
Messages
10
Reaction score
10
Location
Boise, Idaho
Vehicles
Tesla Model X, Mercedes E-Class
Clubs
 
You nailed it. I have just automated your solution, measure the SoC at the start and end of an idle period and multiply by the estimated kWh/%SoC to get units in kWh. I can be a little more accurate since I read the SoC to a tenth of a percent but it also isn't a monotonic function as sometimes it goes up after sitting. Or you get results like this where the 'metabolism' isn't constant:

1703181759203.png


I think this is a case of the battery management software rebalancing cells (so something like that) so it presents as a lower rate of loss.

I had a 2019 M3 and back then the Tesla forums were filled with posts of phantom drain and over time Tesla has improved it, 21W is impressive in my opinion. My other EV is now a Mustang Mach-E which is easy to get data from (working OBDII) and the SoC doesn't budge but I don't think it is as 'connected' as the Rivian and Tesla are.

Rivian can certainly continue to improve this, your estimate of 150W works out to about 3.5kWh per day and is probably inline with other Rivian owners are seeing but an outlier amount current EVs.
You are correct. The metabolism is not consistent. I believe there are some reasons for that (another book) - however keeping all previous data for the times the car sits (over a year and a half time frame now) makes me feel like I have a very accurate average. It pretty much aligns with what you have. I like that I have tons of idle hours on each vehicle and know how much energy (close anyway) used during those idle hours. The MX is impressive - it’s also true. Hummm. Gives me hope that rivian will improve.
 

emoore

Well-Known Member
Joined
Nov 29, 2020
Threads
4
Messages
3,815
Reaction score
4,240
Location
Colorado
Vehicles
2022 R1T
3.5 Kwh is a huge loss daily. I don't think that's the average Rivian owner's loss. Yes there are a few outliers but that seems like a lot. Last winter I tested my loss (via trip meter) and it was consistently 1.2 kWh and then down to about 0.8 kWh in the summer. I haven't tested it since summer but it seems to have gotten even less. Just glancing at the app and I lose 1-2 miles a day which would be around the 0.8 kWh in the summer.
 

VSG

Well-Known Member
Joined
Oct 3, 2022
Threads
4
Messages
3,218
Reaction score
6,011
Location
WA
Vehicles
R1T LE/RB/OC/20
I call it my car’s metabolism. It’s what it takes (the electrical draw) for the car to sit there in the garage appearing to do nothing.
I like this description, and the use of the word "metabolism" to describe the vehicle's idle energy use. It is FAR more accurate and useful than "phantom drain" or "vampire drain".

I especially like it because it recognizes that ALL vehicles use energy when sitting idle. Even my 25 year old ICE 4Runner loses battery when in the driveway. That's why battery maintainers were invented so

When your vehicle is sitting idle, it is actually doing things. With the Rivian, there's a question of whether it needs to be doing these things or not (e.g. phoning home with data dumps). There's a question of whether hardware or software is making the vehicle do things when it shouldn't (e.g. when a seat belt is left buckled). And there's a question of whether the amount of power used to do some of these things is reasonable (does gear guard really take a lot of power?).

Characterizing all these uses is important, mainly IMO as a way to discover if there is a a problem with a particular vehicle. If you see a metabolism where you're using more than 1% of the battery every day, I would suggest you need to go to the doctor. That's about 60W of continuous usage, which put in context sounds pretty reasonable - what's the metabolism of your house when no one is home? Your internet router, phone chargers, TVs, doorbell camera, etc. all use energy when plugged in but idle. I'll bet it's way more than 60W.
 

Janbrink

Member
First Name
Jan
Joined
Dec 10, 2020
Threads
0
Messages
10
Reaction score
10
Location
Boise, Idaho
Vehicles
Tesla Model X, Mercedes E-Class
Clubs
 
I like this description, and the use of the word "metabolism" to describe the vehicle's idle energy use. It is FAR more accurate and useful than "phantom drain" or "vampire drain".

I especially like it because it recognizes that ALL vehicles use energy when sitting idle. Even my 25 year old ICE 4Runner loses battery when in the driveway. That's why battery maintainers were invented so

When your vehicle is sitting idle, it is actually doing things. With the Rivian, there's a question of whether it needs to be doing these things or not (e.g. phoning home with data dumps). There's a question of whether hardware or software is making the vehicle do things when it shouldn't (e.g. when a seat belt is left buckled). And there's a question of whether the amount of power used to do some of these things is reasonable (does gear guard really take a lot of power?).

Characterizing all these uses is important, mainly IMO as a way to discover if there is a a problem with a particular vehicle. If you see a metabolism where you're using more than 1% of the battery every day, I would suggest you need to go to the doctor. That's about 60W of continuous usage, which put in context sounds pretty reasonable - what's the metabolism of your house when no one is home? Your internet router, phone chargers, TVs, doorbell camera, etc. all use energy when plugged in but idle. I'll bet it's way more than 60W.
Bingo!

I’m keenly aware of the metabolism of my house and can measure (and somewhat control) how much I use. In fact my PV Solar (installed 2017) has provided almost all the electric power I’ve used during the past 6 years (I’ve purchased only 5,232 kWh of the 100,244 kWh my house has used during these years). So charging my car is basically free anyway so I’m not loosing sleep over it.

But you are correct. Seems like the truck should see a doctor for an over active something! However, I’ve seen metabolism claims from 0% up to 5% or more overnight. Mine is what it is. As you point out, it could be a multitude of things causing this. I’m not sure even Rivian knows the answer right now. I tend to lean toward usage issues rather than defective vehicles. For example - will it make a difference if I just turn off Gear Gard instead of ā€œOff at Homeā€? I don’t know, and I’m not inclined to start testing this and hundreds of other possible settings like this.

My truck is a low VIN (ordered Dec 2018 delivered Apr 2022) but from what I’ve seen this isn’t the issue. There’s even other issues beyond software and build date/config that could be informative (I’ll save you the list - you already know it). So for now, I’ll wait and watch. With OTA updates (on both my EVs) neither one of these cars are the ones I originally bought! They both seem to get better and better as time goes on. Again, one of these days I’ll break out data to see if the average of recent sessions are better than the ones a year ago. My sense is that it’s getting better.
 

RivRyan

Well-Known Member
First Name
Ryan
Joined
Oct 15, 2023
Threads
8
Messages
217
Reaction score
171
Location
Evanston, IL
Vehicles
Toyota Tundra, ID4
Occupation
consulting
> it recognizes that ALL vehicles use energy when sitting idle

A thing can be true but describe something so meaningless in comparison to the phenomenon being discussed as to be false for practical purposes

I'm buying an ID.4 tonight, and asked this in the ID.4 forum this morning, because I've been reading about it here. People report letting their ID4s sit for several days or a week without noticeable loss. In one case, 6 months.

They also report that wake-up takes a bit longer. But we're talking 1-digit low 2-digit number of seconds. I'd gladly give that up to avoid the energy use. At 1kw / day, over a year you're talking about the power equivalent of driving your truck close to 1,000 miles, lost while just sitting there. That's ridiculous.

I'd like to get an R1T. That decision is probably a year off, and I hope this is resolved. I don't drive daily, don't put a lot of miles on, and would buy in part for environmental reasons. A large vampire draw would negate a lot of the purpose of my buying.
 

Sponsored

NY_Rob

Well-Known Member
First Name
Rob
Joined
Feb 9, 2022
Threads
23
Messages
5,402
Reaction score
7,978
Location
long island
Vehicles
Model 3 LR AWD, BMW i3 REX, 2024 Rubicon 4xe
Occupation
IT
Unfortunately Rivian never scaled back the huge amounts of data their pre-production vehicles transmit with all sorts of metrics streaming day and night back to the mother ship. Yes, the pre-production mules needed to be connected to the mother ship all the time for systems and software verification, etc.. but once they moved to production vehicles.. all that should have stopped, but it didn't and so far Rivian has not addressed that in any meaningful way.
Go back on this forum 2yrs ago and you see the exact same vampire drain complaints and the same energy loss numbers. No improvements in 2 full years.

As a community, we need to make measuring vampire/phantom drain super easy/fast/convenient and most of all consistent and accurate. To that end, if everyone could just reset one of their trip odometers to zero then note the kWh consumed from that same trip odometer next time they use the vehicle that would go a long way to further our cause. The Guess-O-Meter on the driver screen has proven useless for a multitude of reasons and percentages are too course when discussing loss over a 12-24hr period in a 135kWh battery pack. The trip odometer method is the only measurement that actually gives us what we want anyway.. energy lost, not miles (because that's too variable) or percentages.

Stepping off the soapbox.. ?
 
OP
OP
Jiji

Jiji

Well-Known Member
First Name
Rick
Joined
Jun 21, 2023
Threads
17
Messages
296
Reaction score
430
Location
Finger Lakes, NY
Website
github.com
Vehicles
Rivian Blue R1S
As a community, we need to make measuring vampire/phantom drain super easy/fast/convenient and most of all consistent and accurate. To that end, if everyone could just reset one of their trip odometers to zero then note the kWh consumed from that same trip odometer next time they use the vehicle that would go a long way to further our cause. The Guess-O-Meter on the driver screen has proven useless for a multitude of reasons and percentages are too course when discussing loss over a 12-24hr period in a 135kWh battery pack. The trip odometer method is the only measurement that actually gives us what we want anyway.. energy lost, not miles (because that's too variable) or percentages.
If it only was that simple. But I think a better metric would the reported distance to empty since it will show better resolution.

I charged last evening to 70% SoC and then reset the trip odometer to see what it would record as the vehicle sat overnight and all day. The instrument panel Guess-O-Meter SoC display went from 70% to 68% and then to 67% during the few minutes I was grabbing photos of the trip odometer (vehicle was on with headlights and climate control running for a few minutes).:

My iPhone app recorded the same as the Guess-O-Meter:

Rivian R1T R1S Dissecting phantom drain estimates 1703299897680


Not pretty but was cold overnight (low of 20ĀŗF) can cool during the day (high of 30ĀŗF) but this is a loss seen even on warmer days so I don't the battery was conditioned due to temperature.

The bad news is the trip odometer, it is totally MIA, reporting 0.2 kWh over the same period:

Rivian R1T R1S Dissecting phantom drain estimates 1703300116508


I think the efficiency comes from moving the Rivian away from my garage door after charging so not to block another vehicle. But whatever the total energy value contains, it doesn't include whatever drove the SoC down 2.6% in the idle period. I have a trip early in the AM so it will be interesting what the trip odometer reports after the vehicle is driven.
 

jime_r1t

Well-Known Member
First Name
Jim
Joined
Mar 16, 2023
Threads
5
Messages
49
Reaction score
15
Location
Mid-Atlantic
Vehicles
R1T
For me, it appears that my R1T will not stay in sleep state when temperatures drop below 40-45F. I tend to lose about 3-5% every night when it's cold. The 2023.46.0 update may have made some improvement, but I don't have enough consistent data yet.

Here's a 2 week look at the vehicle state and temperature. You can definitely see that the vehicle never sleeps when temperatures are below 40-45F. My guess is that it is using power to maintain battery temperature. I can't imagine what the battery draw would be in really cold temps.

Rivian R1T R1S Dissecting phantom drain estimates 1703302648555
 

Janbrink

Member
First Name
Jan
Joined
Dec 10, 2020
Threads
0
Messages
10
Reaction score
10
Location
Boise, Idaho
Vehicles
Tesla Model X, Mercedes E-Class
Clubs
 
Unfortunately Rivian never scaled back the huge amounts of data their pre-production vehicles transmit with all sorts of metrics streaming day and night back to the mother ship. Yes, the pre-production mules needed to be connected to the mother ship all the time for systems and software verification, etc.. but once they moved to production vehicles.. all that should have stopped, but it didn't and so far Rivian has not addressed that in any meaningful way.
Go back on this forum 2yrs ago and you see the exact same vampire drain complaints and the same energy loss numbers. No improvements in 2 full years.

As a community, we need to make measuring vampire/phantom drain super easy/fast/convenient and most of all consistent and accurate. To that end, if everyone could just reset one of their trip odometers to zero then note the kWh consumed from that same trip odometer next time they use the vehicle that would go a long way to further our cause. The Guess-O-Meter on the driver screen has proven useless for a multitude of reasons and percentages are too course when discussing loss over a 12-24hr period in a 135kWh battery pack. The trip odometer method is the only measurement that actually gives us what we want anyway.. energy lost, not miles (because that's too variable) or percentages.

Stepping off the soapbox.. ?

Not exactly… at least not for me.

The trip meter method for me is highly inconsistent and inaccurate. I don’t know why. It can report anything from .2 to 3 kWh In a 24 hour period. Maybe it’s just my truck?

What I do know is that my truck has sat in the garage for a documented total of 479.25 hours, and during those same hours I documented that the SOC on the dash went down a total of 54%. When I do document down time, I make sure it sits unplugged for a minimum of 24 hours (usually longer) and I’ve done these tests off and on for over 1.5 years. This is why I say my truck has a metabolism of around 150W. Go figure. Iā€˜ve never reset the trip meter while doing one of these sitting tests (for comparison) but will do that from now on.
 
OP
OP
Jiji

Jiji

Well-Known Member
First Name
Rick
Joined
Jun 21, 2023
Threads
17
Messages
296
Reaction score
430
Location
Finger Lakes, NY
Website
github.com
Vehicles
Rivian Blue R1S
For me, it appears that my R1T will not stay in sleep state when temperatures drop below 40-45F. I tend to lose about 3-5% every night when it's cold. The 2023.46.0 update may have made some improvement, but I don't have enough consistent data yet.
I thought you were on to something so I modified my iPhone app to show the outdoor temperature during idle periods.

This is a graph of the 6 hours or greater idle periods during the past week where the I see two distinct groups of idle losses. The yellow periods have a much higher idle loss than the green periods so does this have anything to due with the outdoor temperatures?

Rivian R1T R1S Dissecting phantom drain estimates 1703806651393


I now have a detailed look at idle periods so let's compare the first two:

Rivian R1T R1S Dissecting phantom drain estimates 1703806991471


In both cases the mean temperature was at or below freezing so it seems that perhaps the Rivian likes to warm the battery to keep it from getting too cold.

Now look at the two green idle periods from the first screenshot:

Rivian R1T R1S Dissecting phantom drain estimates 1703807257601


In these two idle periods the temperature never dropped below 40ĀŗF and both show minimal loss of range with mean temperatures in mid-40ĀŗFs.

It will be above average for the next few days but hopefully I will see some freezing temperatures by the weekend and see if the trend returns. And just maybe I can catch an increase in battery temperature above the ambient to confirm the cause since the trip odometer doesn't seem to capture this big drain on the HV battery.
Sponsored


Top