Sponsored

mkg3

Well-Known Member
Joined
Nov 19, 2021
Threads
90
Messages
2,787
Reaction score
3,702
Location
SoCal
Vehicles
R1S, Model 3, Outback, Artura
Clubs
 
What you wrote is true of ICE vehicles, but EVs do not behave the same way. While it may take more power to accelerate, EVs are able to recapture much of that when decelerating. It's the steady state power needed to overcome air resistance that is unrecoverable, and hence the main driver of EV energy use.

EVs typically get HIGHER MPGe ratings on the city cycle than the highway cycle. E.g., the Gen 1 R1T has an EPA rated MPGe of 74 city, but 66 highway.
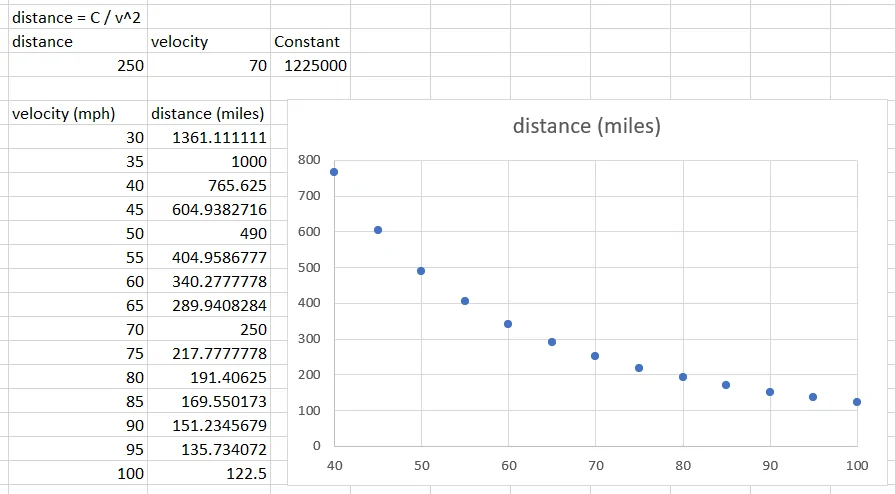
True to a point, and it also depends on the regen setting. Many EVs have variable regen setting more than Rivian's High-Std-Low. Also it depends on how hard one accelerates when driving.

There are many technical papers that proves coasting is more efficient than constant transient between power-on and regen on open highway driving.
Sponsored


DCFC

Well-Known Member
Joined
Jul 13, 2024
Threads
0
Messages
154
Reaction score
162
Location
SoCal
Vehicles
P2
K, I'm a bit more with it this morning. Assumed 250 miles at 70mph as the reference point to calculate a constant to bundle in battery capacity, drag, frontal area, etc. Plotted out. Of course, this is a much more simplified calculation which leaves out the details of linear scaling of rolling friction, etc. Just wanted to see the shape of the curve which my initial intuition was incorrect about.
Rivian R1T R1S R2 Highway Range at 70MPH = ~250 Miles (Modeled) 1777301949190-g9
 
Last edited:

tivoboy

Well-Known Member
First Name
Paul
Joined
Nov 8, 2025
Threads
2
Messages
194
Reaction score
191
Location
Palo Alto, CA
Vehicles
M3
I didn't dig into the calculations the AI did, but I think something is amiss. I plotted out the numbers and the curve has the wrong inflection. As speed increases, the range should drop exponentially. As noted, the power requirement goes up to the 3rd power with velocity. I drew in a representative curve shape, ignore the position. Be careful about trusting AI.

Edit: I was wrong about the inflection of the curve :)
1777252897413-05.webp
This is one of the things that has always confused and confounded me.

IT SEEMS logically, as speed increases, energy to maintain or increase speed should increase measurably (if not truly EXPONENTIALLY), but that has never been my actual experience.

I go back to the days living in Germany working for a large german OEM.. having the pick of the litter from the executive garage stable. Doing long duration and distance road trips, I could measure over time, distance and speed the change in MPG at various LARGE deltas of speed.

65mgh, 100mph and 150+mph..

At say 90mph, I could get my battle axe CLK AMG55 to do ~ 18mpg on an unrestricted autobahn for long stretches (mostly at night or early AM heading south to Switzerland)..

But taking it up to 150mph, and traveling at around those speeds, sometimes higher sometimes lower, but avg 150mph I would only see MPG drop to ~ 15-16 mpg.. Now one would expect to see a near doubling in speed essentially HALVE the overall MPG, but that was not the case, it was more like a 15-20% reduction in efficiency. So even straight line maths didn't math, and EXPONENTIAL increases in energy consumption didn't either.

I could never really get an engineer at the OEM to explain this to me, the how and why. Other than to say, at SOME point there IS a sleight re-gain of efficiency (or signifiant slower or stopping of the IN-EFFICIENCY curve), so directionally it doesn't just keep going up but they couldn't math it for me.

Had the same experience though with other cars, even large top product sedans, heavy with big V12 (slightly worse though, those things were pigs to begin with)

And with an America Roadster I had but the top sustained speeds were even higher.

So we know there are optimal speeds for any vehicle, ambient temp, environmental conditions, terrain, etc, and then there are SUB-OPTIMAL as speed increases, but even though it gets worse as speed increases, it wouldn't appear to be a straight straight line, or a J curve

I would imagine in the OP post, the blue dots would stop falling, and just flatten out at some value X for range/measure of energy.
 

mkhuffman

Well-Known Member
First Name
Mike
Joined
Nov 9, 2020
Threads
14
Messages
2,840
Reaction score
3,202
Location
Virginia
Vehicles
2025 R1T Tri-Max, Jeep GC-L, VW Jetta
This is one of the things that has always confused and confounded me.

IT SEEMS logically, as speed increases, energy to maintain or increase speed should increase measurably (if not truly EXPONENTIALLY), but that has never been my actual experience.

I go back to the days living in Germany working for a large german OEM.. having the pick of the litter from the executive garage stable. Doing long duration and distance road trips, I could measure over time, distance and speed the change in MPG at various LARGE deltas of speed.

65mgh, 100mph and 150+mph..

At say 90mph, I could get my battle axe CLK AMG55 to do ~ 18mpg on an unrestricted autobahn for long stretches (mostly at night or early AM heading south to Switzerland)..

But taking it up to 150mph, and traveling at around those speeds, sometimes higher sometimes lower, but avg 150mph I would only see MPG drop to ~ 15-16 mpg.. Now one would expect to see a near doubling in speed essentially HALVE the overall MPG, but that was not the case, it was more like a 15-20% reduction in efficiency. So even straight line maths didn't math, and EXPONENTIAL increases in energy consumption didn't either.

I could never really get an engineer at the OEM to explain this to me, the how and why. Other than to say, at SOME point there IS a sleight re-gain of efficiency (or signifiant slower or stopping of the IN-EFFICIENCY curve), so directionally it doesn't just keep going up but they couldn't math it for me.

Had the same experience though with other cars, even large top product sedans, heavy with big V12 (slightly worse though, those things were pigs to begin with)

And with an America Roadster I had but the top sustained speeds were even higher.

So we know there are optimal speeds for any vehicle, ambient temp, environmental conditions, terrain, etc, and then there are SUB-OPTIMAL as speed increases, but even though it gets worse as speed increases, it wouldn't appear to be a straight straight line, or a J curve

I would imagine in the OP post, the blue dots would stop falling, and just flatten out at some value X for range/measure of energy.
I have read that tires that are high speed rated actually get more efficient as speed increases (rolling resistance decreases as you drive faster). I suspect this is one of the reasons you didn't see a bigger drop in efficiency.
 

Sponsored

mkg3

Well-Known Member
Joined
Nov 19, 2021
Threads
90
Messages
2,787
Reaction score
3,702
Location
SoCal
Vehicles
R1S, Model 3, Outback, Artura
Clubs
 
This is one of the things that has always confused and confounded me.

IT SEEMS logically, as speed increases, energy to maintain or increase speed should increase measurably (if not truly EXPONENTIALLY), but that has never been my actual experience.

I go back to the days living in Germany working for a large german OEM.. having the pick of the litter from the executive garage stable. Doing long duration and distance road trips, I could measure over time, distance and speed the change in MPG at various LARGE deltas of speed.

65mgh, 100mph and 150+mph..

At say 90mph, I could get my battle axe CLK AMG55 to do ~ 18mpg on an unrestricted autobahn for long stretches (mostly at night or early AM heading south to Switzerland)..

But taking it up to 150mph, and traveling at around those speeds, sometimes higher sometimes lower, but avg 150mph I would only see MPG drop to ~ 15-16 mpg.. Now one would expect to see a near doubling in speed essentially HALVE the overall MPG, but that was not the case, it was more like a 15-20% reduction in efficiency. So even straight line maths didn't math, and EXPONENTIAL increases in energy consumption didn't either.

I could never really get an engineer at the OEM to explain this to me, the how and why. Other than to say, at SOME point there IS a sleight re-gain of efficiency (or signifiant slower or stopping of the IN-EFFICIENCY curve), so directionally it doesn't just keep going up but they couldn't math it for me.

Had the same experience though with other cars, even large top product sedans, heavy with big V12 (slightly worse though, those things were pigs to begin with)

And with an America Roadster I had but the top sustained speeds were even higher.

So we know there are optimal speeds for any vehicle, ambient temp, environmental conditions, terrain, etc, and then there are SUB-OPTIMAL as speed increases, but even though it gets worse as speed increases, it wouldn't appear to be a straight straight line, or a J curve

I would imagine in the OP post, the blue dots would stop falling, and just flatten out at some value X for range/measure of energy.
Probably because higher powered engines required not much increase in the engine RPMs. If you had done the same with a small lower HP vehicle, the engine would be wide open at max RPM around 5000 vs AMG running between 2500~3000 PRMs.

In other words, the fuel consumptions increase was smaller in a high HP vehicle than a low HP vehicle. In pure MPG perspective, smaller vehicle with less HP may still be more economical but the relative fuel consumption percentage difference between the speeds impacts lower HP vehicle more.
 

NoMoreGas71

Member
Joined
Mar 26, 2025
Threads
1
Messages
23
Reaction score
27
Location
Atlanta
Vehicles
Tesla Model S, Lexus TX 350, Chevy Trax
So is this not correct??


Driving slower and charging less often is more efficient. Here’s why:
Aerodynamic drag is the key factor. Air resistance increases with the square of your speed, meaning the power needed to overcome it grows cubically. Going from 60 to 80 mph doesn’t just add a third more drag — it nearly doubles the energy required to push through the air.
Battery efficiency also drops at high speeds. EV motors and inverters operate less efficiently at high power outputs, and regenerative braking can’t recover energy lost to air resistance (only to deceleration).
Charging has its own losses. Every charge cycle loses some energy as heat — typically 10–20% depending on the charger and battery state. More frequent charging means more of these losses stack up over a trip.
The numbers in practice: At highway speeds, going from 70 mph to 80 mph can cut your range by 15–25%. Slowing to 60 mph can extend it by a similar margin.
The one nuance: this assumes steady cruising. Stop-and-go city driving at low speeds is surprisingly costly due to frequent acceleration, though EVs partially recover that through regenerative braking. The optimal speed for most EVs is roughly 25–40 mph — well below typical highway speeds.
Bottom line: Speed is the enemy of EV efficiency. The slower you drive (within reason), the fewer kWh per mile you use, and the less you need to stop and charge.
 
OP
OP
TexasBob

TexasBob

Well-Known Member
First Name
Bob
Joined
Jan 15, 2022
Threads
49
Messages
1,190
Reaction score
2,635
Location
Houston
Vehicles
2024 R1T DM LRG, 2025 R1S Dune
So is this not correct??
...
Bottom line: Speed is the enemy of EV efficiency. The slower you drive (within reason), the fewer kWh per mile you use, and the less you need to stop and charge.
That is all correct but that does not get you there faster. Using a simple example:

550 mile trip avg fast charging speed 150kw:

60 mph -3 mi / kwh
  • Start 75 kwh usable charge -> 225 miles/60mph = 3.75 hours
  • Charge stop 1 -> recharge 60 kwh = 0.4 hours
  • Leg 2 another (60kwh x 3) 180 miles = 3 hours
  • Charge stop 2 -> recharge 48 kwh = 0.32 hrs
  • Leg 3 (48 kwh x 3) 144 miles = 2.4 hrs
  • Arrive total miles 225 + 180 + 144 = 549
  • Arrive total time 3.75+0.4+3.0+0.32+2.4= 9.87 hours
  • Total kwh: 75+60+48 = 183kwh
80 mph ~2 mi / kwh (extreme example)
  • Start 75 kwh usable charge -> 150 miles/80mph = 1.87 hours
  • Charge stop 1 -> recharge 60 kwh = 0.4 hours
  • Leg 2 another (60kwh x 2) 120 miles = 1.5 hours
  • Charge stop 2 -> recharge 60 kwh = 0.4 hours
  • Leg 3 another (60kwh x 2) 120 miles = 1.5 hours
  • Charge stop 3-> recharge 60 kwh = 0.4 hours
  • Leg 4 another (60kwh x 2) 120 miles = 1.5 hours
  • Charge stop 4 -> recharge 20 kwh = 0.13 hrs
  • Leg 5 another (20 kwh x 2) 40 miles = 0.5 hrs
  • Arrive total miles 150+120+120+120+40 = 550
  • Arrive total time 1.87+0.4+1.5+0.4+1.5+0.4+1.5+0.13+0.5= 8.2 hours
  • Total kwh: 75+60+60+60+20 = 275kwh
 

Jeremy3292

Well-Known Member
First Name
Jeremy
Joined
Apr 27, 2026
Threads
1
Messages
294
Reaction score
352
Location
South Carolina
Vehicles
R2
It's funny this thread exists bc I have always assumed on every Tesla I have owned (3/Y LR) that 250 miles is a fair estimate for highway speed range, even at avg 80 mph speeds. If it's cold out you may get less, if it's warm out you may get more but 250 miles is the number I settled on when determining my trips. It also has proven to be an accurate estimate over the years too.
 

Sponsored

racekarl

Well-Known Member
Joined
Jan 5, 2023
Threads
9
Messages
555
Reaction score
825
Location
MA
Vehicles
2023 R1T
But taking it up to 150mph, and traveling at around those speeds, sometimes higher sometimes lower, but avg 150mph I would only see MPG drop to ~ 15-16 mpg.. Now one would expect to see a near doubling in speed essentially HALVE the overall MPG, but that was not the case, it was more like a 15-20% reduction in efficiency. So even straight line maths didn't math, and EXPONENTIAL increases in energy consumption didn't either.
Many of the things that stand out about EV vs. ICE behavior can be explained by the huge gulf in efficiency between the two.

An EV powertrain is something like 80-90% efficient, whereas as an ICE powertrain is more like 20-30% efficient.

When 80% of the fuel you burn in an ICE just goes to heating the air around it, you don't notice the changes in efficiency from weather, speed, etc. as easily. In your example, the doubling of speed would only affect the 20-30% of consumption actually used to move the vehicle.
 

NoMoreGas71

Member
Joined
Mar 26, 2025
Threads
1
Messages
23
Reaction score
27
Location
Atlanta
Vehicles
Tesla Model S, Lexus TX 350, Chevy Trax
That is all correct but that does not get you there faster. Using a simple example:

550 mile trip avg fast charging speed 150kw:

60 mph -3 mi / kwh
  • Start 75 kwh usable charge -> 225 miles/60mph = 3.75 hours
  • Charge stop 1 -> recharge 60 kwh = 0.4 hours
  • Leg 2 another (60kwh x 3) 180 miles = 3 hours
  • Charge stop 2 -> recharge 48 kwh = 0.32 hrs
  • Leg 3 (48 kwh x 3) 144 miles = 2.4 hrs
  • Arrive total miles 225 + 180 + 144 = 549
  • Arrive total time 3.75+0.4+3.0+0.32+2.4= 9.87 hours
  • Total kwh: 75+60+48 = 183kwh
80 mph ~2 mi / kwh (extreme example)
  • Start 75 kwh usable charge -> 150 miles/80mph = 1.87 hours
  • Charge stop 1 -> recharge 60 kwh = 0.4 hours
  • Leg 2 another (60kwh x 2) 120 miles = 1.5 hours
  • Charge stop 2 -> recharge 60 kwh = 0.4 hours
  • Leg 3 another (60kwh x 2) 120 miles = 1.5 hours
  • Charge stop 3-> recharge 60 kwh = 0.4 hours
  • Leg 4 another (60kwh x 2) 120 miles = 1.5 hours
  • Charge stop 4 -> recharge 20 kwh = 0.13 hrs
  • Leg 5 another (20 kwh x 2) 40 miles = 0.5 hrs
  • Arrive total miles 150+120+120+120+40 = 550
  • Arrive total time 1.87+0.4+1.5+0.4+1.5+0.4+1.5+0.13+0.5= 8.2 hours
  • Total kwh: 75+60+60+60+20 = 275kwh
Excellent! Thank you!
 

DCFC

Well-Known Member
Joined
Jul 13, 2024
Threads
0
Messages
154
Reaction score
162
Location
SoCal
Vehicles
P2
This is one of the things that has always confused and confounded me.

IT SEEMS logically, as speed increases, energy to maintain or increase speed should increase measurably (if not truly EXPONENTIALLY), but that has never been my actual experience.

I go back to the days living in Germany working for a large german OEM.. having the pick of the litter from the executive garage stable. Doing long duration and distance road trips, I could measure over time, distance and speed the change in MPG at various LARGE deltas of speed.

65mgh, 100mph and 150+mph..

At say 90mph, I could get my battle axe CLK AMG55 to do ~ 18mpg on an unrestricted autobahn for long stretches (mostly at night or early AM heading south to Switzerland)..

But taking it up to 150mph, and traveling at around those speeds, sometimes higher sometimes lower, but avg 150mph I would only see MPG drop to ~ 15-16 mpg.. Now one would expect to see a near doubling in speed essentially HALVE the overall MPG, but that was not the case, it was more like a 15-20% reduction in efficiency. So even straight line maths didn't math, and EXPONENTIAL increases in energy consumption didn't either.

I could never really get an engineer at the OEM to explain this to me, the how and why. Other than to say, at SOME point there IS a sleight re-gain of efficiency (or signifiant slower or stopping of the IN-EFFICIENCY curve), so directionally it doesn't just keep going up but they couldn't math it for me.

Had the same experience though with other cars, even large top product sedans, heavy with big V12 (slightly worse though, those things were pigs to begin with)

And with an America Roadster I had but the top sustained speeds were even higher.

So we know there are optimal speeds for any vehicle, ambient temp, environmental conditions, terrain, etc, and then there are SUB-OPTIMAL as speed increases, but even though it gets worse as speed increases, it wouldn't appear to be a straight straight line, or a J curve

I would imagine in the OP post, the blue dots would stop falling, and just flatten out at some value X for range/measure of energy.
This is actually easy to explain. Internal combustion engines are notoriously inefficient at low loads. At higher loads, their efficiency goes up (less throttling losses as the throttle body is open more, more heat energy goes into pushing the piston down instead of into the coolant/oil/exhaust, etc). Every internal combustion engine will have what's called the Brake Specific Fuel Consumption map. The units in this particular plot are grams of fuel burned to get a kWh of energy out of it. So, the lower the number the better. This study had a bunch of different drive cycles plotted on the map. I drew in the red line to illustration going from a lower cruising speed/lower load to a higher cruising speed/higher load. At the higher load, you can see the BSFC values get lower which means better efficiency. Peak internal combustion engine efficiency is always at high load and low-mid engine rpm. Engine friction increase exponentially with engine speed.

Rivian R1T R1S R2 Highway Range at 70MPH = ~250 Miles (Modeled) 1777346561419-hg


Top