
Sponsored

MountainBikeDude

Well-Known Member
First Name
Adam
Joined
Jun 20, 2019
Threads
55
Messages
3,348
Reaction score
7,135
Location
Vancouver
Vehicles
2023 El Cap Quad Motor R1T (Selling the Xterra)
Clubs
 
Can you grab the data next time? When I checked my Gen1 large pack, I saw no difference above 50%>
I haven't seen any improvements to the Gen 1 Large. It still walks down in the same way pre and post 2024.18.1
Sponsored


MountainBikeDude

Well-Known Member
First Name
Adam
Joined
Jun 20, 2019
Threads
55
Messages
3,348
Reaction score
7,135
Location
Vancouver
Vehicles
2023 El Cap Quad Motor R1T (Selling the Xterra)
Clubs
 
I don't believe they claimed there was any change to the Gen 1 Large with this update.
Agreed, but some were claiming improvements
 

NC-Rivian

Well-Known Member
First Name
Greg
Joined
Jul 31, 2022
Threads
33
Messages
383
Reaction score
672
Location
Hendersonville, NC
Vehicles
LA Silver R1T; Blue R1S
Occupation
Sales
Agreed, but some were claiming improvements
I am one who is claiming improvement in both my G1 Large T and S. Of course, some variation exists between Tesla SC sites (and even between stalls) but my unscientific observation using the same SC stall (3D in Hendersonville NC) pre-18.01 and post-, max kW holds longer (mid- to late 40’s%) AND 140kW+ to late 60’s. Clearly a better charging curve.
 

2kwik4u

Well-Known Member
First Name
Michael
Joined
Jan 8, 2025
Threads
12
Messages
889
Reaction score
1,138
Location
Western NY State
Vehicles
2024 Rivian R1T ; 2018 Nissan Rogue
The charging curve doesn't tell the charging story completely. It's the time to add X amount of energy that is important.
Area under the curve is -quite literally- what you are measuring. A taller and or "fatter" curve will deliver more energy in less time.

Y-axis is kW (power), X-axis is hrs (time). Energy is defined as power * time (kWh). The curve has no option but to tell the story completely, it's the definition of the story.

A change to the charging curve that looks "big" doesn't necessarily translate into a big reducing in charging time. I'm only seeing a minute or two of improvement over a 20 to 30 minute charging session. And that is during sessions that have charging curves that hold power over 200 kw for a long time like this one of mine.
You aren't seeing a massive reduction in total time for a couple reasons. First, you only have one data point. Second, that data point does include the larger increases in the upper 20% of the battery, and finally the total peak rate was barely changed on your truck. So, while your single experience isn't a huge increase, that doesn't mean that the improved overall curve isn't beneficial.
 
  • Like
Reactions: VSG

Sponsored

SeaGeo

Well-Known Member
First Name
Brice
Joined
Jan 12, 2021
Threads
50
Messages
5,673
Reaction score
10,212
Location
Seattle
Vehicles
Xc60 T8
Occupation
Engineer
I am one who is claiming improvement in both my G1 Large T and S. Of course, some variation exists between Tesla SC sites (and even between stalls) but my unscientific observation using the same SC stall (3D in Hendersonville NC) pre-18.01 and post-, max kW holds longer (mid- to late 40’s%) AND 140kW+ to late 60’s. Clearly a better charging curve.

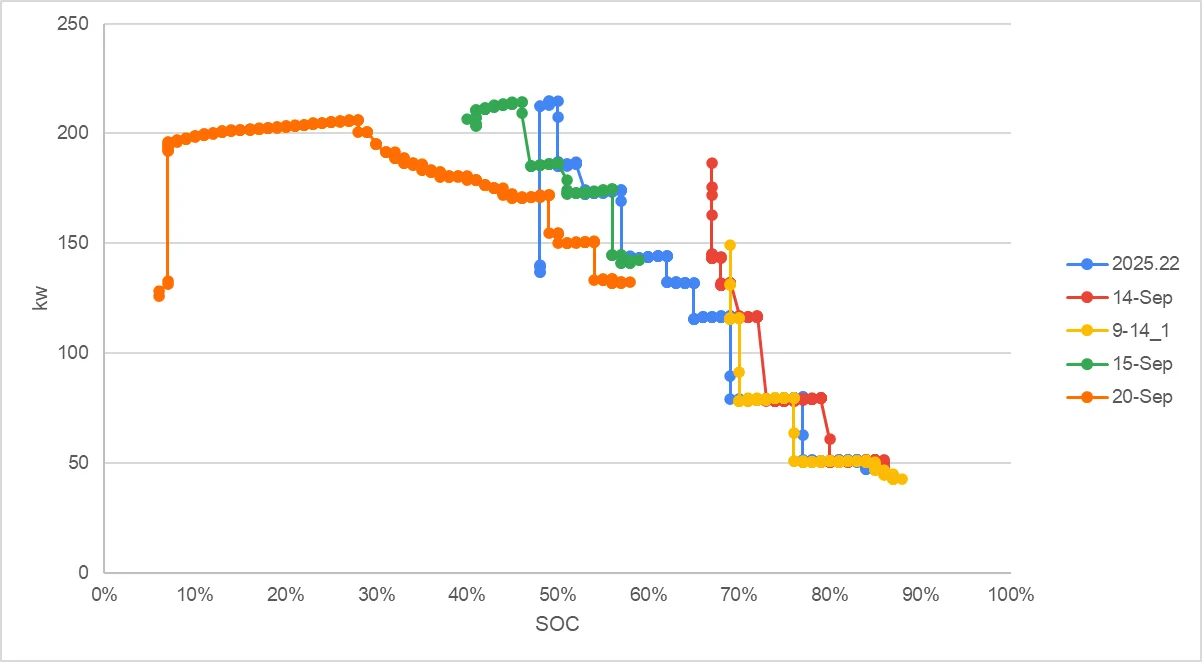
2025.22 matches pretty well to what I saw in September for charges plugged. The 9-20 charge obviously had some thermal derating and for whatever reason was stepping down about 2 to 4% earlier.

Rivian R1T R1S Gen 2 Max Pack Fast Charging Speed with 2025.18.01 Update 1749752661162-2
 

mkhuffman

Well-Known Member
First Name
Mike
Joined
Nov 9, 2020
Threads
14
Messages
3,022
Reaction score
3,435
Location
Virginia
Vehicles
2025 R1T Tri-Max, Jeep GC-L, VW Jetta
On my way home from work yesterday, I stopped at a RAN. For science.

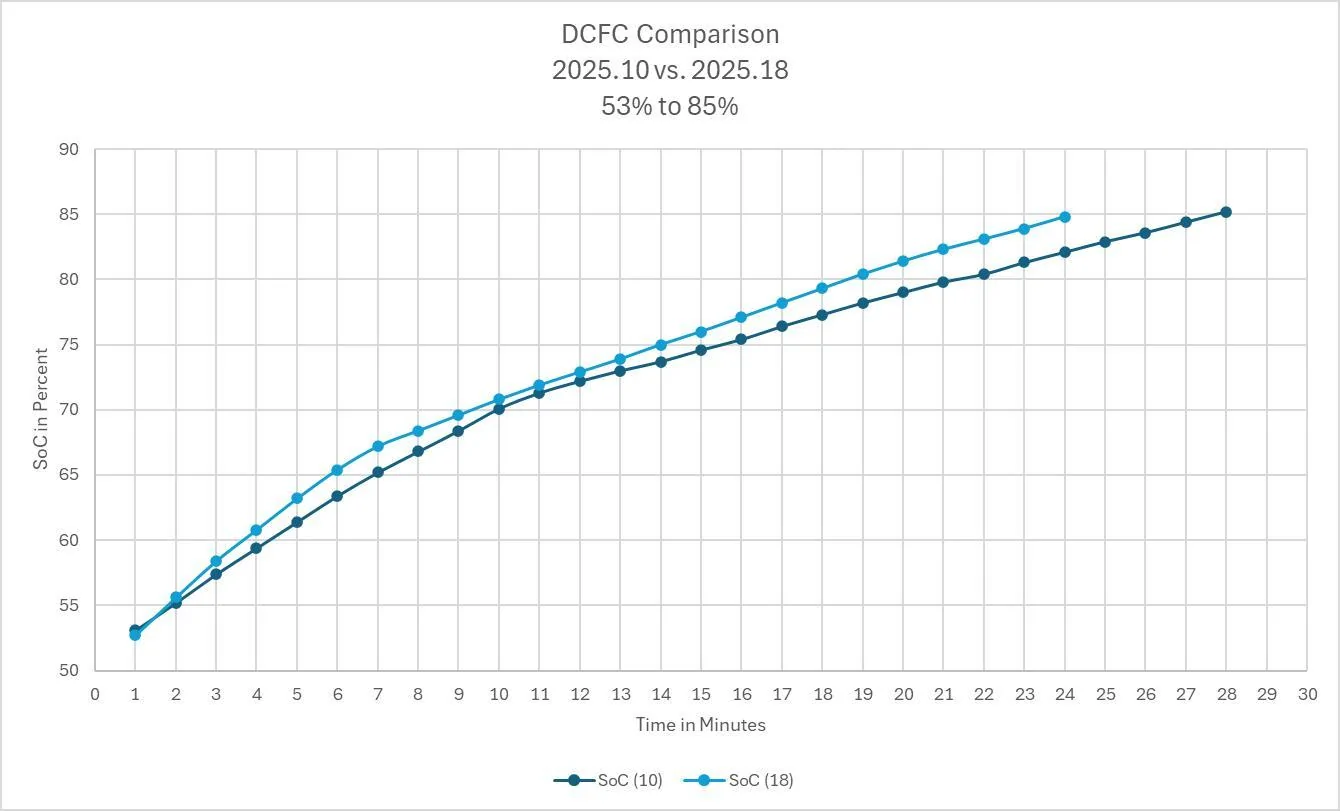
I could have easily made it home without charging, but I wanted to compare the 50-80 speed improvement since I did a RAN charge when on 2025-10. I wish I had time to run it up to 95%, but I really needed to get home.

It now gets to 85% from 53% four minutes faster. Four minutes is a big deal when you are done peeing and are just sitting there, ready to go.

Rivian R1T R1S Gen 2 Max Pack Fast Charging Speed with 2025.18.01 Update 1749777589412-3g


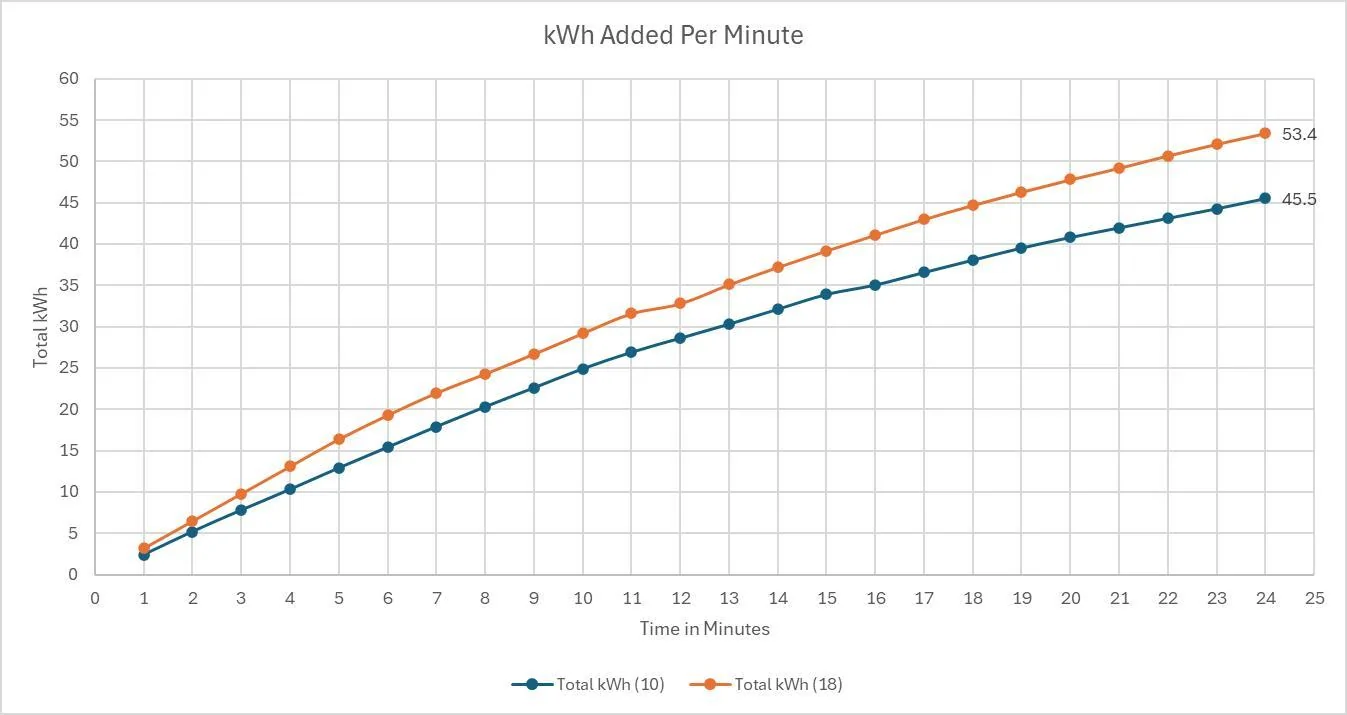
Interestingly, I discovered that it is actually faster than that, because the truck accepted 3.4 kWh more in that 53-85 window in the 2025.18 session.

2025.10: 45.5 kWh added in 24 minutes.
2025.18: 53.4 kWh added in 24 minutes, which is 17% faster. That is significant.

I believe the difference compared to SoC is due to the BMS variations. SoC is just an estimate, and I think "kWh added" is more accurate than the SoC estimate. IMO.

Rivian R1T R1S Gen 2 Max Pack Fast Charging Speed with 2025.18.01 Update 1749778120353-tm


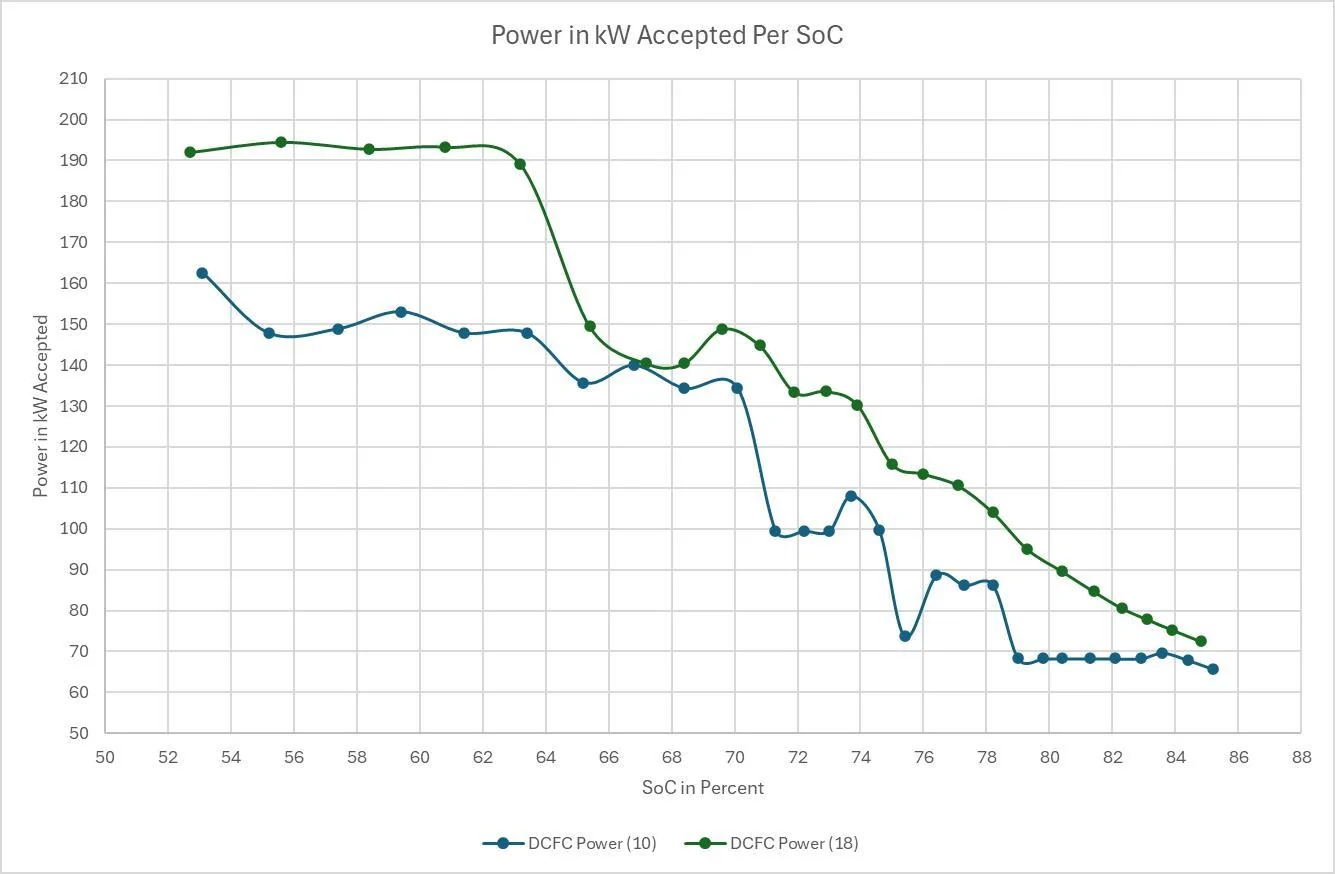
Below is the speed of the DCFC session at the same SoC. At around 64% in the 2025.18 session, it must have hit a thermal limit or something that caused it to drop suddenly. Not sure what caused that, but the speed was almost identical at 67% SoC. That was the only time they were even close.

Rivian R1T R1S Gen 2 Max Pack Fast Charging Speed with 2025.18.01 Update 1749778424012-lr


By the way, this is Electrifi data, so it is the data reported by the truck. The charger was delivering well over 200 kW up to around 64%. (It hit a max of 213.48 kW per my receipt from Rivian).

I doubt Rivian can improve the speed much beyond this considering it is 400V architecture. And for a 400V vehicle, this is an excellent charging curve.

Both charging sessions were performed on a RAN charger, with my truck being the only one at the station both times. I love RAN. So much less stressful than EA, or even Tesla (which also gets filled up depending on the station location). I don't care that it costs more. It is worth it.
Sponsored


Top